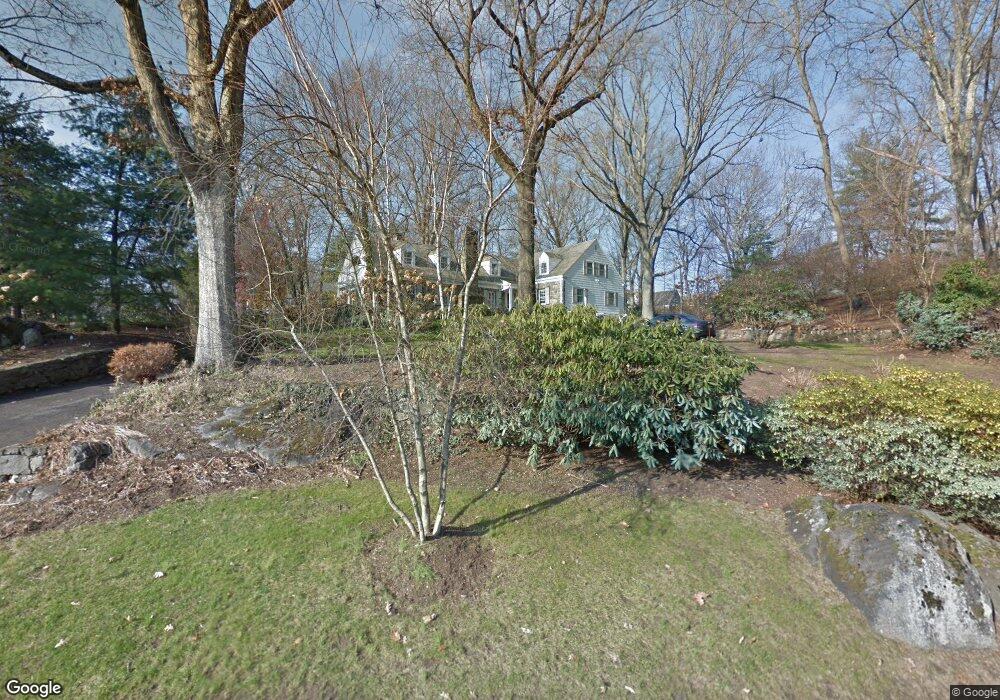
38 Delafield Island Rd Darien, CT 06820
Estimated Value: $2,597,258 - $3,716,000
4
Beds
6
Baths
4,284
Sq Ft
$756/Sq Ft
Est. Value
About This Home
This home is located at 38 Delafield Island Rd, Darien, CT 06820 and is currently estimated at $3,237,315, approximately $755 per square foot. 38 Delafield Island Rd is a home located in Fairfield County with nearby schools including Tokeneke Elementary School, Middlesex Middle School, and Darien High School.
Ownership History
Date
Name
Owned For
Owner Type
Purchase Details
Closed on
Jun 19, 2024
Sold by
Woznitski Laura J
Bought by
Kaufman Laura W and Kaufman Alan H
Current Estimated Value
Purchase Details
Closed on
May 27, 2015
Sold by
Kaufman Alan
Bought by
Woznitski Laura J
Home Financials for this Owner
Home Financials are based on the most recent Mortgage that was taken out on this home.
Original Mortgage
$282,000
Interest Rate
3.24%
Purchase Details
Closed on
Aug 8, 1997
Sold by
Schaeffer Philip S and Hutton-Schaeffer Sara
Bought by
Kaufman Alan H and Kaufman Laurence G
Purchase Details
Closed on
Jun 30, 1992
Sold by
Harrington Thomas
Bought by
Schaeffer Philip and Schaeffer Sara
Create a Home Valuation Report for This Property
The Home Valuation Report is an in-depth analysis detailing your home's value as well as a comparison with similar homes in the area
Home Values in the Area
Average Home Value in this Area
Purchase History
We collect this data history from publicly available records. To have your information removed, we recommend requesting removal directly through your county’s website.
| Date | Buyer | Sale Price | Title Company |
|---|---|---|---|
| Kaufman Laura W | -- | None Available | |
| Kaufman Laura W | -- | None Available | |
| Woznitski Laura J | $2,000,000 | -- | |
| Kaufman Alan | -- | -- | |
| Kaufman Alan H | $1,325,000 | -- | |
| Kaufman Alan | -- | -- | |
| Kaufman Alan H | $1,325,000 | -- | |
| Schaeffer Philip | $1,015,000 | -- |
Source: Public Records
Mortgage History
We collect this data history from publicly available records. To have your information removed, we recommend requesting removal directly through your county’s website.
| Date | Status | Borrower | Loan Amount |
|---|---|---|---|
| Previous Owner | Schaeffer Philip | $282,000 | |
| Previous Owner | Schaeffer Philip | $1,400,000 | |
| Previous Owner | Schaeffer Philip | $0 |
Source: Public Records
Tax History
| Year | Tax Paid | Tax Assessment Tax Assessment Total Assessment is a certain percentage of the fair market value that is determined by local assessors to be the total taxable value of land and additions on the property. | Land | Improvement |
|---|---|---|---|---|
| 2025 | $16,716 | $1,079,820 | $672,700 | $407,120 |
| 2024 | $15,863 | $1,079,820 | $672,700 | $407,120 |
| 2023 | $16,290 | $925,050 | $560,560 | $364,490 |
| 2022 | $15,939 | $925,050 | $560,560 | $364,490 |
| 2021 | $3,414 | $925,050 | $560,560 | $364,490 |
| 2020 | $15,134 | $925,050 | $560,560 | $364,490 |
| 2019 | $15,236 | $925,050 | $560,560 | $364,490 |
| 2018 | $17,792 | $1,106,490 | $648,620 | $457,870 |
| 2017 | $17,881 | $1,106,490 | $648,620 | $457,870 |
| 2016 | $17,449 | $1,106,490 | $648,620 | $457,870 |
| 2015 | $16,985 | $1,106,490 | $648,620 | $457,870 |
| 2014 | -- | $1,106,490 | $648,620 | $457,870 |
Source: Public Records
Map
Nearby Homes
- 72 Old Kings Hwy S
- 15 Queens Ln
- 20 Locust Hill Rd
- 10 Queens Ln
- 115 Tokeneke Rd
- 30 Hale Ln
- 16 East Trail
- 50 Hale Ln
- 7 Raiders Ln
- 161 Old Kings Hwy S
- 53 Goodwives River Rd
- 1 Sedgwick Ave Unit 2-06
- 28 Old Farm Rd
- 13 Sunswyck Rd
- 18 Tokeneke Trail
- 25 Lakeside Ave
- 3 Rocaton Rd
- 33 Fairview Ave
- 45 Old Farm Rd
- 13 Darien Close
- 54 Andrews Dr
- 32 Delafield Island Rd
- 34 Delafield Island Rd
- 41 Delafield Island Rd
- 29 Delafield Island Rd
- 58 Andrews Dr
- 34 Andrews Dr
- 8 Brushy Hill Rd
- 55 Andrews Dr
- 25 Delafield Island Rd
- 45 Delafield Island Rd
- 43 Cedar Gate Rd
- 39 Cedar Gate Rd
- 42 Delafield Island Rd
- 12 Brushy Hill Rd
- 35 Cedar Gate Rd
- 31 Cedar Gate Rd
- 61 Andrews Dr
- 14 Locust Hill Rd
- 47 Delafield Island Rd
Your Personal Tour Guide
Ask me questions while you tour the home.