Estimated Value: $919,654 - $1,081,000
2
Beds
2
Baths
1,935
Sq Ft
$510/Sq Ft
Est. Value
About This Home
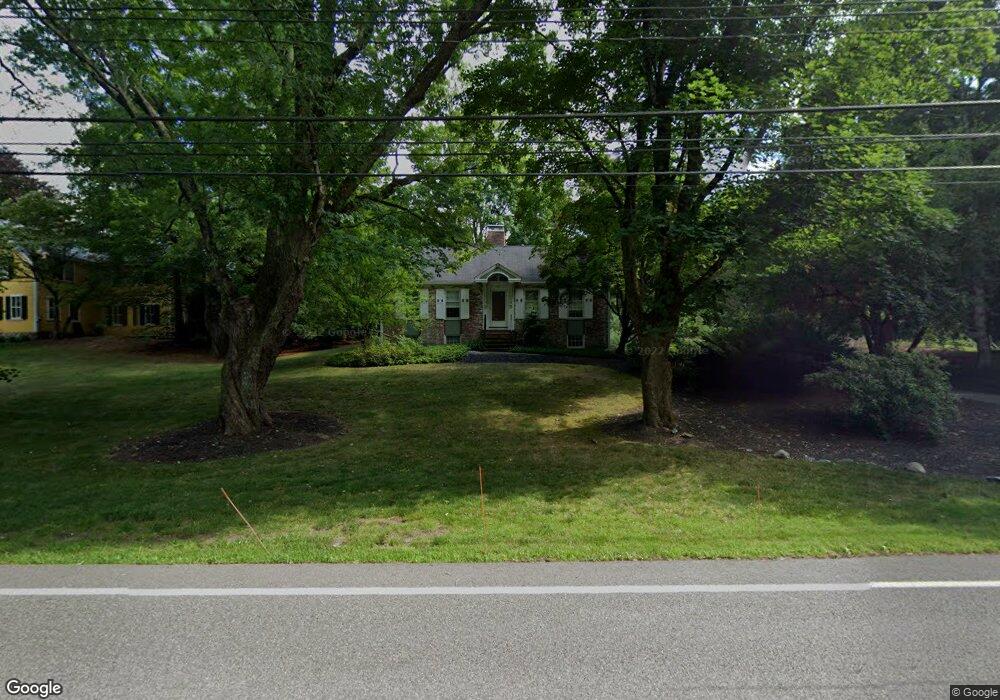
This home is located at 38 Dover Rd, Dover, MA 02030 and is currently estimated at $987,664, approximately $510 per square foot. 38 Dover Rd is a home located in Middlesex County with nearby schools including Chickering Elementary School, Dover-Sherborn Regional Middle School, and Dover-Sherborn Regional High School.
Ownership History
Date
Name
Owned For
Owner Type
Purchase Details
Closed on
Apr 10, 2017
Sold by
Wetherbee Pamela K
Bought by
Wetherbe Pamela Knight
Current Estimated Value
Purchase Details
Closed on
May 31, 2007
Sold by
Bachman David L
Bought by
Wetherbee Pamela K
Purchase Details
Closed on
Jun 7, 2000
Sold by
Levinson Robert R and Levinson Jill M
Bought by
Bachman David L
Purchase Details
Closed on
Apr 28, 1995
Sold by
Price Ex Mary F
Bought by
Levinson Robert R and Levinson Jill M
Create a Home Valuation Report for This Property
The Home Valuation Report is an in-depth analysis detailing your home's value as well as a comparison with similar homes in the area
Home Values in the Area
Average Home Value in this Area
Purchase History
| Date | Buyer | Sale Price | Title Company |
|---|---|---|---|
| Wetherbe Pamela Knight | -- | -- | |
| Wetherbee Pamela K | $531,000 | -- | |
| Bachman David L | $335,000 | -- | |
| Levinson Robert R | $247,300 | -- |
Source: Public Records
Mortgage History
| Date | Status | Borrower | Loan Amount |
|---|---|---|---|
| Previous Owner | Levinson Robert R | $120,000 | |
| Previous Owner | Levinson Robert R | $10,000 |
Source: Public Records
Tax History
| Year | Tax Paid | Tax Assessment Tax Assessment Total Assessment is a certain percentage of the fair market value that is determined by local assessors to be the total taxable value of land and additions on the property. | Land | Improvement |
|---|---|---|---|---|
| 2025 | $9,053 | $803,300 | $507,800 | $295,500 |
| 2024 | $8,804 | $803,300 | $507,800 | $295,500 |
| 2023 | $7,939 | $651,300 | $400,800 | $250,500 |
| 2022 | $7,810 | $628,800 | $400,800 | $228,000 |
| 2021 | $8,105 | $628,800 | $400,800 | $228,000 |
| 2020 | $8,074 | $628,800 | $400,800 | $228,000 |
| 2019 | $8,130 | $628,800 | $400,800 | $228,000 |
| 2018 | $6,921 | $539,000 | $328,800 | $210,200 |
| 2017 | $6,906 | $529,200 | $319,000 | $210,200 |
| 2016 | $6,874 | $533,700 | $319,000 | $214,700 |
| 2015 | $6,778 | $533,700 | $319,000 | $214,700 |
Source: Public Records
Map
Nearby Homes
Your Personal Tour Guide
Ask me questions while you tour the home.