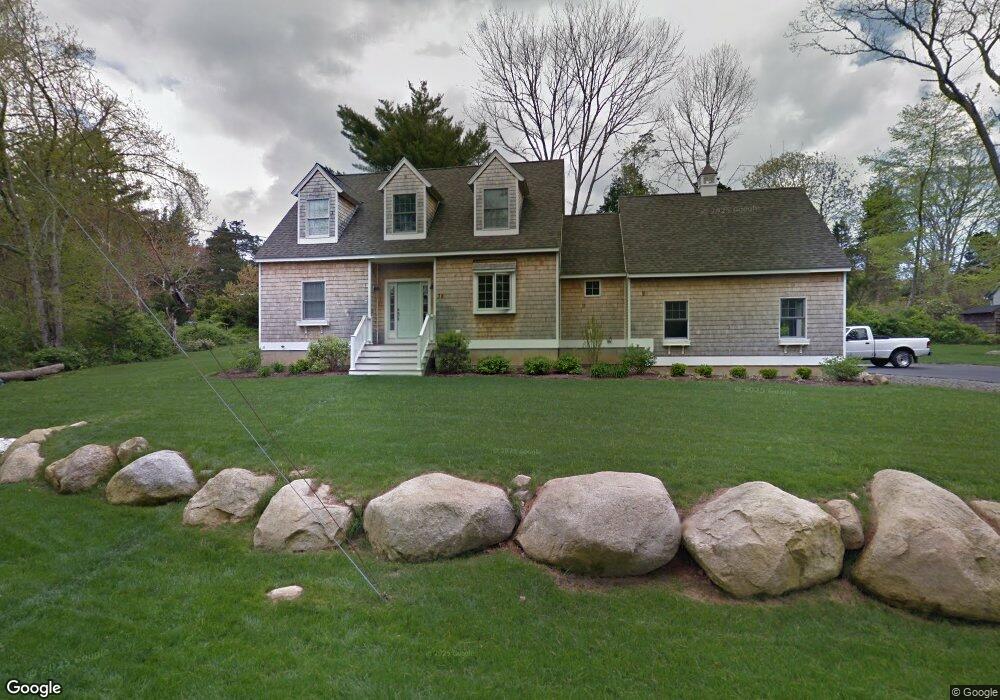
38 Gounod Rd Westerly, RI 02891
Estimated Value: $1,270,000 - $1,434,000
3
Beds
4
Baths
2,120
Sq Ft
$636/Sq Ft
Est. Value
About This Home
This home is located at 38 Gounod Rd, Westerly, RI 02891 and is currently estimated at $1,347,272, approximately $635 per square foot. 38 Gounod Rd is a home located in Washington County with nearby schools including Westerly High School.
Ownership History
Date
Name
Owned For
Owner Type
Purchase Details
Closed on
Mar 23, 2021
Sold by
Perkins Ian M
Bought by
Perkins Ian M and Perkins Emily M
Current Estimated Value
Home Financials for this Owner
Home Financials are based on the most recent Mortgage that was taken out on this home.
Original Mortgage
$324,500
Outstanding Balance
$278,624
Interest Rate
2.9%
Mortgage Type
New Conventional
Estimated Equity
$1,068,648
Purchase Details
Closed on
Apr 25, 2005
Sold by
Perkins Sharon and Knowles Stephen
Bought by
Perkins Robert and Perkins Sharon
Create a Home Valuation Report for This Property
The Home Valuation Report is an in-depth analysis detailing your home's value as well as a comparison with similar homes in the area
Home Values in the Area
Average Home Value in this Area
Purchase History
| Date | Buyer | Sale Price | Title Company |
|---|---|---|---|
| Perkins Ian M | -- | None Available | |
| Perkins Robert | $100,000 | -- | |
| Perkins Robert | $100,000 | -- |
Source: Public Records
Mortgage History
| Date | Status | Borrower | Loan Amount |
|---|---|---|---|
| Open | Perkins Ian M | $324,500 | |
| Previous Owner | Perkins Robert | $265,000 | |
| Previous Owner | Perkins Robert | $100,000 | |
| Previous Owner | Perkins Robert | $275,000 | |
| Previous Owner | Perkins Robert | $275,000 |
Source: Public Records
Tax History
| Year | Tax Paid | Tax Assessment Tax Assessment Total Assessment is a certain percentage of the fair market value that is determined by local assessors to be the total taxable value of land and additions on the property. | Land | Improvement |
|---|---|---|---|---|
| 2025 | $8,288 | $1,165,700 | $688,600 | $477,100 |
| 2024 | $8,939 | $911,200 | $492,000 | $419,200 |
| 2023 | $8,766 | $911,200 | $492,000 | $419,200 |
| 2022 | $8,711 | $911,200 | $492,000 | $419,200 |
| 2021 | $8,301 | $720,600 | $406,400 | $314,200 |
| 2020 | $8,150 | $720,600 | $406,400 | $314,200 |
| 2019 | $8,071 | $720,600 | $406,400 | $314,200 |
| 2018 | $7,360 | $619,500 | $374,300 | $245,200 |
| 2017 | $7,180 | $619,500 | $374,300 | $245,200 |
| 2016 | $7,236 | $619,500 | $374,300 | $245,200 |
| 2015 | $6,857 | $633,700 | $382,200 | $251,500 |
| 2014 | $6,743 | $633,700 | $382,200 | $251,500 |
Source: Public Records
Map
Nearby Homes
- 346 Post Rd
- 342 Post Rd
- 14 Evergreen Ln
- 137 Cove Point Rd E
- 5 Robin Hollow Ln
- 43 Noyes Neck Rd
- 853 W Beach Rd
- 135 Ross Hill Rd
- 143 Ross Hill Rd
- 11 Bucks Trail
- 112 Noyes Neck Rd
- 5717 Post Rd
- 7 Fenway Rd
- 34 Buddington Rd
- 15 Breach Dr
- 22 Breach Dr
- 30 Clifford Dr
- 20 Snowberry Ln
- 46 Salt Pond Way
- 13 Plateau Rd
Your Personal Tour Guide
Ask me questions while you tour the home.