38 Jerome St Berkley, MA 02779
Estimated Value: $767,000 - $888,000
4
Beds
2
Baths
2,784
Sq Ft
$301/Sq Ft
Est. Value
About This Home
This home is located at 38 Jerome St, Berkley, MA 02779 and is currently estimated at $837,048, approximately $300 per square foot. 38 Jerome St is a home located in Bristol County with nearby schools including Berkley Community School and Our Lady of Lourdes School.
Ownership History
Date
Name
Owned For
Owner Type
Purchase Details
Closed on
Nov 7, 2017
Sold by
Botelho Louis M
Bought by
Coelho Kimberyl
Current Estimated Value
Home Financials for this Owner
Home Financials are based on the most recent Mortgage that was taken out on this home.
Original Mortgage
$279,650
Outstanding Balance
$233,087
Interest Rate
3.83%
Mortgage Type
New Conventional
Estimated Equity
$603,961
Purchase Details
Closed on
Apr 1, 1983
Bought by
Botelho Louis M
Create a Home Valuation Report for This Property
The Home Valuation Report is an in-depth analysis detailing your home's value as well as a comparison with similar homes in the area
Home Values in the Area
Average Home Value in this Area
Purchase History
| Date | Buyer | Sale Price | Title Company |
|---|---|---|---|
| Coelho Kimberyl | $485,000 | -- | |
| Botelho Louis M | $16,800 | -- |
Source: Public Records
Mortgage History
| Date | Status | Borrower | Loan Amount |
|---|---|---|---|
| Open | Coelho Kimberyl | $279,650 | |
| Previous Owner | Botelho Louis M | $23,000 |
Source: Public Records
Tax History Compared to Growth
Tax History
| Year | Tax Paid | Tax Assessment Tax Assessment Total Assessment is a certain percentage of the fair market value that is determined by local assessors to be the total taxable value of land and additions on the property. | Land | Improvement |
|---|---|---|---|---|
| 2025 | $99 | $823,700 | $227,900 | $595,800 |
| 2024 | $9,715 | $780,300 | $208,100 | $572,200 |
| 2023 | $9,389 | $710,200 | $208,100 | $502,100 |
| 2022 | $8,779 | $638,500 | $192,000 | $446,500 |
| 2021 | $18,275 | $601,500 | $186,900 | $414,600 |
| 2020 | $3,979 | $596,100 | $175,200 | $420,900 |
| 2019 | $3,829 | $575,300 | $175,200 | $400,100 |
| 2018 | $3,624 | $553,300 | $171,700 | $381,600 |
| 2017 | $3,186 | $521,300 | $182,200 | $339,100 |
| 2016 | $7,206 | $485,600 | $182,200 | $303,400 |
| 2015 | $6,816 | $490,000 | $182,200 | $307,800 |
| 2014 | $6,382 | $498,200 | $190,400 | $307,800 |
Source: Public Records
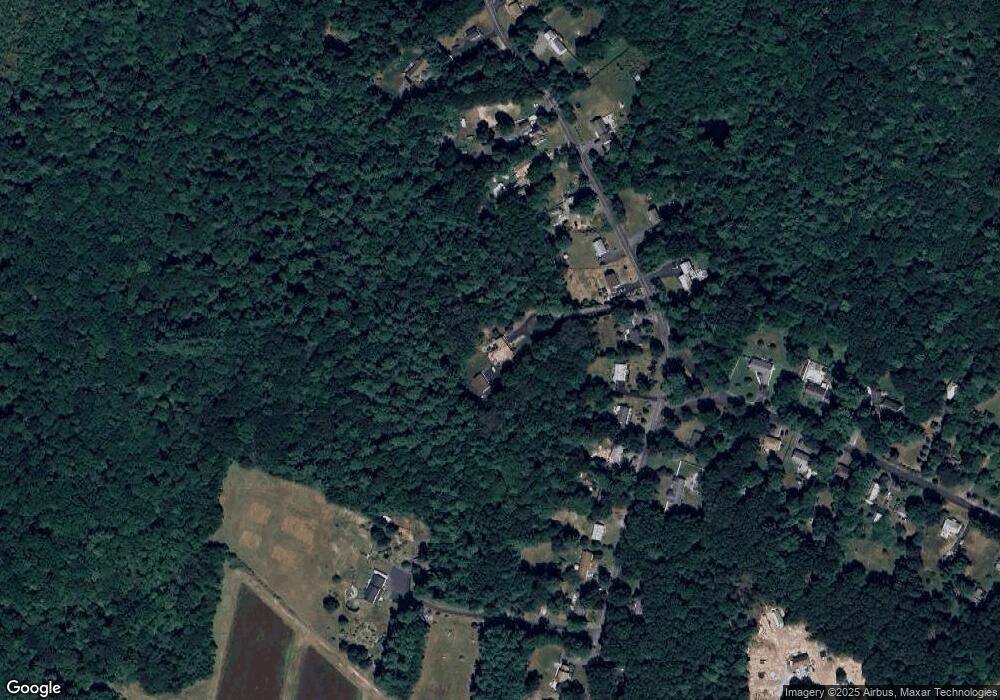
Map
Nearby Homes