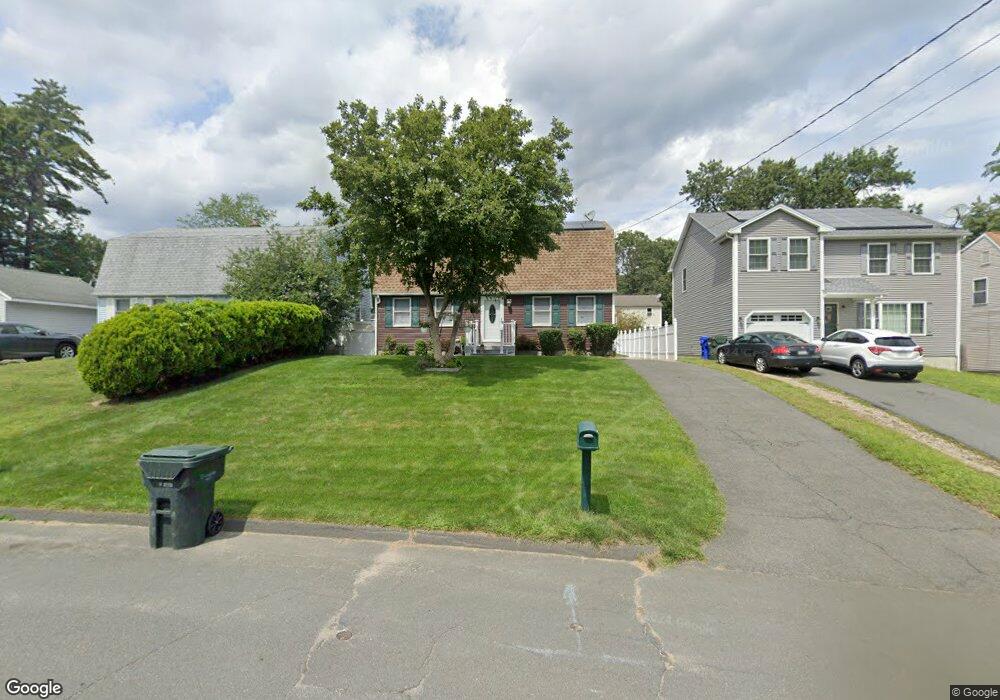
38 Jordan St Springfield, MA 01129
Sixteen Acres NeighborhoodEstimated Value: $346,575 - $407,000
5
Beds
2
Baths
1,872
Sq Ft
$199/Sq Ft
Est. Value
About This Home
This home is located at 38 Jordan St, Springfield, MA 01129 and is currently estimated at $372,394, approximately $198 per square foot. 38 Jordan St is a home located in Hampden County with nearby schools including Warner, M Marcus Kiley Middle, and Springfield Central High School.
Ownership History
Date
Name
Owned For
Owner Type
Purchase Details
Closed on
Jul 1, 1998
Sold by
Zaloga Rebecca H
Bought by
Collins Jimmy Q and Augustus-Collins Hope
Current Estimated Value
Home Financials for this Owner
Home Financials are based on the most recent Mortgage that was taken out on this home.
Original Mortgage
$91,453
Interest Rate
7.04%
Mortgage Type
Purchase Money Mortgage
Purchase Details
Closed on
Aug 14, 1987
Sold by
Girard Mark F
Bought by
Kinglsey Thomas M
Create a Home Valuation Report for This Property
The Home Valuation Report is an in-depth analysis detailing your home's value as well as a comparison with similar homes in the area
Home Values in the Area
Average Home Value in this Area
Purchase History
| Date | Buyer | Sale Price | Title Company |
|---|---|---|---|
| Collins Jimmy Q | $91,500 | -- | |
| Kinglsey Thomas M | $91,900 | -- |
Source: Public Records
Mortgage History
| Date | Status | Borrower | Loan Amount |
|---|---|---|---|
| Open | Kinglsey Thomas M | $169,479 | |
| Closed | Kinglsey Thomas M | $25,000 | |
| Closed | Kinglsey Thomas M | $91,453 |
Source: Public Records
Tax History
| Year | Tax Paid | Tax Assessment Tax Assessment Total Assessment is a certain percentage of the fair market value that is determined by local assessors to be the total taxable value of land and additions on the property. | Land | Improvement |
|---|---|---|---|---|
| 2025 | $4,925 | $314,100 | $56,900 | $257,200 |
| 2024 | $4,948 | $308,100 | $56,900 | $251,200 |
| 2023 | $4,823 | $282,900 | $54,200 | $228,700 |
| 2022 | $4,261 | $226,400 | $54,200 | $172,200 |
| 2021 | $4,500 | $238,100 | $49,300 | $188,800 |
| 2020 | $4,019 | $205,800 | $49,300 | $156,500 |
| 2019 | $3,903 | $198,300 | $49,300 | $149,000 |
| 2018 | $3,891 | $197,700 | $49,300 | $148,400 |
| 2017 | $3,783 | $192,400 | $44,500 | $147,900 |
| 2016 | $3,706 | $188,500 | $44,500 | $144,000 |
| 2015 | $3,366 | $171,100 | $44,500 | $126,600 |
Source: Public Records
Map
Nearby Homes
- 44 Jordan St
- 34 Jordan St
- 48 Jordan St
- 26 Jordan St
- 52 Jordan St
- 281 Parkerview St
- 285 Parkerview St
- 271 Parkerview St
- 287 Parkerview St
- 287 Parkerview St
- 56 Jordan St
- 37 Jordan St
- 295 Parkerview St
- 265 Parkerview St Unit 267
- 47 Jordan St
- 2 lots Jordan St
- 301 Parkerview St
- 64 Jordan St
- 53 Jordan St
- 23 Jordan St
Your Personal Tour Guide
Ask me questions while you tour the home.