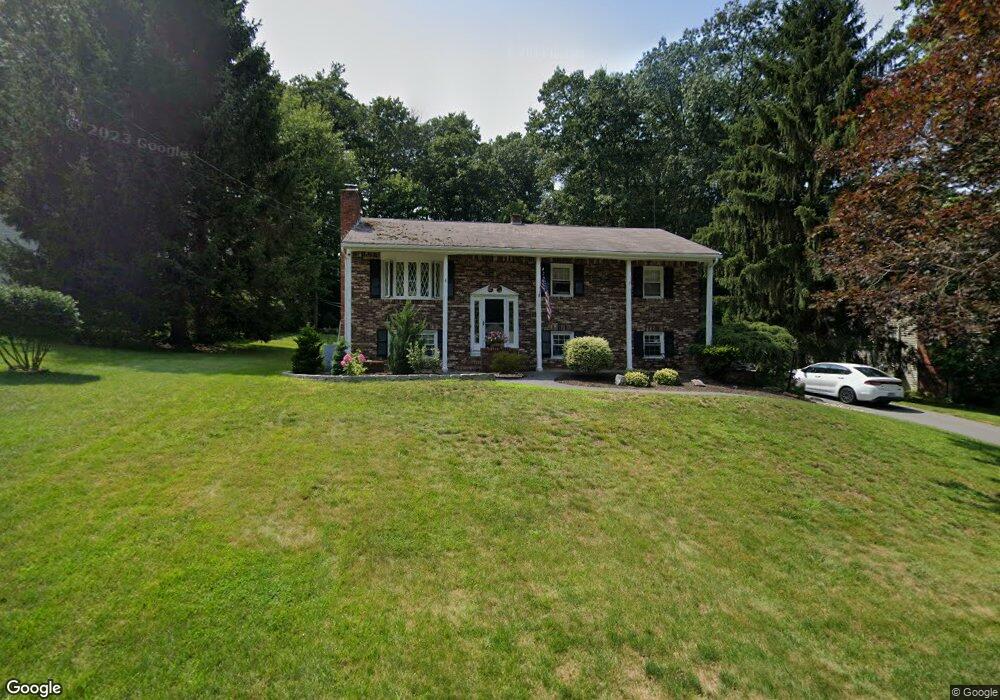
38 Joseph Rd Salem, NH 03079
Depot Village NeighborhoodEstimated Value: $551,000 - $603,000
3
Beds
2
Baths
1,716
Sq Ft
$341/Sq Ft
Est. Value
About This Home
This home is located at 38 Joseph Rd, Salem, NH 03079 and is currently estimated at $584,552, approximately $340 per square foot. 38 Joseph Rd is a home located in Rockingham County with nearby schools including Mary A. Fisk Elementary School, Woodbury School, and Salem High School.
Ownership History
Date
Name
Owned For
Owner Type
Purchase Details
Closed on
Jun 1, 2007
Sold by
Spurr Jeffrey A and Spurr Linda D
Bought by
Gannon Robert M and Gannon Deborah J
Current Estimated Value
Home Financials for this Owner
Home Financials are based on the most recent Mortgage that was taken out on this home.
Original Mortgage
$256,000
Interest Rate
6.24%
Mortgage Type
Purchase Money Mortgage
Purchase Details
Closed on
Oct 17, 2005
Sold by
Yanovitch John P and Yanovitch Bridie P
Bought by
Spurr Jeffrey A and Spurr Linda D
Home Financials for this Owner
Home Financials are based on the most recent Mortgage that was taken out on this home.
Original Mortgage
$335,900
Interest Rate
5.78%
Mortgage Type
Purchase Money Mortgage
Create a Home Valuation Report for This Property
The Home Valuation Report is an in-depth analysis detailing your home's value as well as a comparison with similar homes in the area
Home Values in the Area
Average Home Value in this Area
Purchase History
| Date | Buyer | Sale Price | Title Company |
|---|---|---|---|
| Gannon Robert M | $328,000 | -- | |
| Spurr Jeffrey A | $335,900 | -- |
Source: Public Records
Mortgage History
| Date | Status | Borrower | Loan Amount |
|---|---|---|---|
| Open | Gannon Robert M | $260,000 | |
| Closed | Gannon Robert M | $256,000 | |
| Previous Owner | Spurr Jeffrey A | $335,900 |
Source: Public Records
Tax History Compared to Growth
Tax History
| Year | Tax Paid | Tax Assessment Tax Assessment Total Assessment is a certain percentage of the fair market value that is determined by local assessors to be the total taxable value of land and additions on the property. | Land | Improvement |
|---|---|---|---|---|
| 2024 | $7,809 | $443,700 | $174,400 | $269,300 |
| 2023 | $7,525 | $443,700 | $174,400 | $269,300 |
| 2022 | $7,121 | $443,700 | $174,400 | $269,300 |
| 2021 | $7,090 | $443,700 | $174,400 | $269,300 |
| 2020 | $6,106 | $277,300 | $124,800 | $152,500 |
| 2019 | $6,095 | $277,300 | $124,800 | $152,500 |
| 2018 | $5,992 | $277,300 | $124,800 | $152,500 |
| 2017 | $5,779 | $277,300 | $124,800 | $152,500 |
| 2016 | $5,665 | $277,300 | $124,800 | $152,500 |
| 2015 | $5,270 | $246,400 | $124,200 | $122,200 |
| 2014 | $5,123 | $246,400 | $124,200 | $122,200 |
| 2013 | $5,041 | $246,400 | $124,200 | $122,200 |
Source: Public Records
Map
Nearby Homes
- 11 Sullivan Ct
- 17 Clinton St
- 3 S Shore Rd
- 4 Therriault Ave
- 89 End St
- 30 Scotland Ave
- 8 Alta Ave
- 17 Grove Ave
- 5 Pine Ridge Rd
- 108 S Shore Rd
- 75 S Policy St Unit 45
- 75 S Policy St Unit 48
- 55A Millville Cir
- 25 Range Rd
- 10 Harris Rd
- 133 Brookdale Rd
- 2 Dennison Ave
- 51 Zion Hill Rd
- 6-18 Mary Anthony Dr
- 51 Bluff St