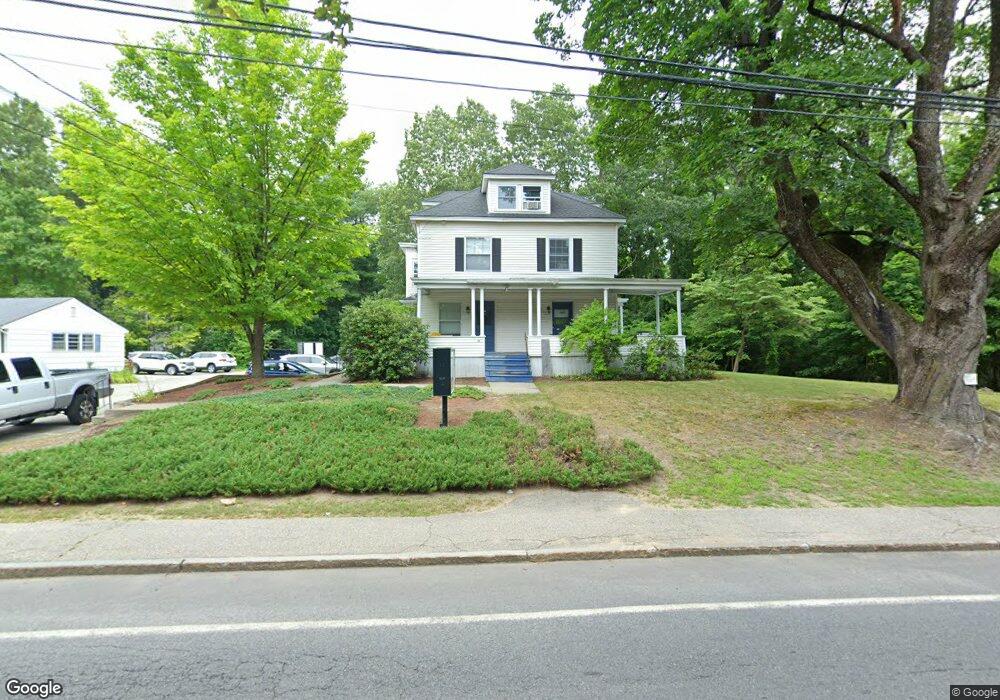
38 Library St Hudson, NH 03051
Estimated Value: $625,824
16
Beds
2
Baths
2,749
Sq Ft
$228/Sq Ft
Est. Value
About This Home
This home is located at 38 Library St, Hudson, NH 03051 and is currently estimated at $625,824, approximately $227 per square foot. 38 Library St is a home located in Hillsborough County with nearby schools including White Wing School, Presentation of Mary Academy, and Clearway High School.
Ownership History
Date
Name
Owned For
Owner Type
Purchase Details
Closed on
Oct 5, 2022
Sold by
Phoenix Dev Group Llc
Bought by
Alvarez Prop Llc
Current Estimated Value
Purchase Details
Closed on
May 5, 2021
Sold by
G Squared Properties Llc
Bought by
Phoenix Dev Grp Llc
Home Financials for this Owner
Home Financials are based on the most recent Mortgage that was taken out on this home.
Original Mortgage
$360,000
Interest Rate
3.1%
Mortgage Type
Purchase Money Mortgage
Purchase Details
Closed on
Oct 22, 2019
Sold by
Sarris John R
Bought by
G Squared Properties Llc
Home Financials for this Owner
Home Financials are based on the most recent Mortgage that was taken out on this home.
Original Mortgage
$250,000
Interest Rate
3.4%
Purchase Details
Closed on
Oct 20, 1971
Bought by
Sarris John R
Create a Home Valuation Report for This Property
The Home Valuation Report is an in-depth analysis detailing your home's value as well as a comparison with similar homes in the area
Home Values in the Area
Average Home Value in this Area
Purchase History
| Date | Buyer | Sale Price | Title Company |
|---|---|---|---|
| Alvarez Prop Llc | $495,000 | None Available | |
| Phoenix Dev Grp Llc | $400,000 | None Available | |
| G Squared Properties Llc | $240,000 | -- | |
| Sarris John R | -- | -- |
Source: Public Records
Mortgage History
| Date | Status | Borrower | Loan Amount |
|---|---|---|---|
| Previous Owner | Phoenix Dev Grp Llc | $360,000 | |
| Previous Owner | G Squared Properties Llc | $250,000 | |
| Previous Owner | Sarris John R | $400,000 |
Source: Public Records
Tax History Compared to Growth
Tax History
| Year | Tax Paid | Tax Assessment Tax Assessment Total Assessment is a certain percentage of the fair market value that is determined by local assessors to be the total taxable value of land and additions on the property. | Land | Improvement |
|---|---|---|---|---|
| 2024 | $6,919 | $420,600 | $219,500 | $201,100 |
| 2023 | $6,595 | $420,600 | $219,500 | $201,100 |
| 2022 | $5,828 | $396,700 | $231,700 | $165,000 |
| 2021 | $6,438 | $297,100 | $154,300 | $142,800 |
| 2020 | $6,338 | $296,600 | $154,300 | $142,300 |
| 2019 | $6,191 | $305,300 | $154,300 | $151,000 |
| 2018 | $5,962 | $296,600 | $154,300 | $142,300 |
| 2017 | $5,849 | $296,600 | $154,300 | $142,300 |
| 2016 | $5,251 | $239,000 | $130,400 | $108,600 |
| 2015 | $5,079 | $239,000 | $130,400 | $108,600 |
| 2014 | $4,978 | $239,000 | $130,400 | $108,600 |
| 2013 | $4,881 | $237,400 | $130,400 | $107,000 |
Source: Public Records
Map
Nearby Homes