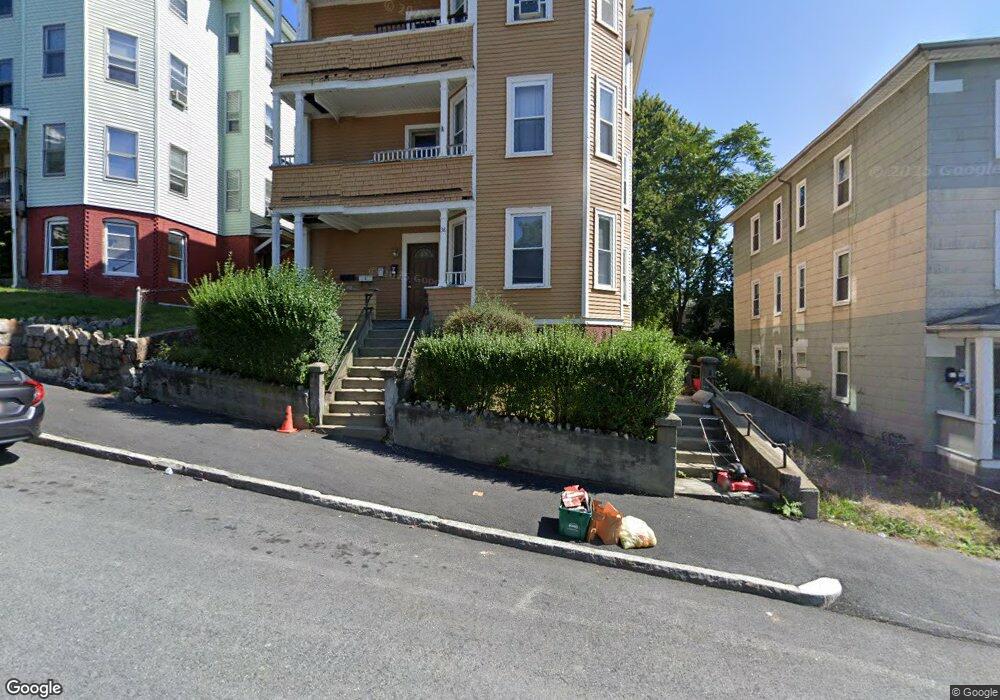
38 Merrifield St Worcester, MA 01605
Shrewsbury Street NeighborhoodEstimated Value: $699,000 - $781,000
6
Beds
3
Baths
4,133
Sq Ft
$178/Sq Ft
Est. Value
About This Home
This home is located at 38 Merrifield St, Worcester, MA 01605 and is currently estimated at $734,000, approximately $177 per square foot. 38 Merrifield St is a home located in Worcester County with nearby schools including Jacob Hiatt Magnet School, Chandler Magnet, and Worcester East Middle School.
Ownership History
Date
Name
Owned For
Owner Type
Purchase Details
Closed on
Jul 18, 2024
Sold by
Juhl Jonathan N
Bought by
38 Merrifield Llc
Current Estimated Value
Purchase Details
Closed on
Jul 11, 2011
Sold by
Sovereign Bank
Bought by
Juhl Jonathan N
Purchase Details
Closed on
Dec 9, 2010
Sold by
Sovereign Bank and Riddle
Bought by
Sovereign Bk
Purchase Details
Closed on
Feb 28, 2003
Sold by
Dunkerly Jay S and Dunkerly Jean M
Bought by
Riddle Ii Richard J and Riddle Jennifer
Home Financials for this Owner
Home Financials are based on the most recent Mortgage that was taken out on this home.
Original Mortgage
$183,900
Interest Rate
5.98%
Mortgage Type
Purchase Money Mortgage
Purchase Details
Closed on
Sep 7, 1990
Sold by
Dunkerly John A
Bought by
Dunkerly Jay S
Create a Home Valuation Report for This Property
The Home Valuation Report is an in-depth analysis detailing your home's value as well as a comparison with similar homes in the area
Home Values in the Area
Average Home Value in this Area
Purchase History
| Date | Buyer | Sale Price | Title Company |
|---|---|---|---|
| 38 Merrifield Llc | -- | None Available | |
| 38 Merrifield Llc | -- | None Available | |
| Juhl Jonathan N | $95,000 | -- | |
| 38 Merrifield Llc | -- | -- | |
| Juhl Jonathan N | $95,000 | -- | |
| Sovereign Bk | $124,000 | -- | |
| Sovereign Bk | $124,000 | -- | |
| Riddle Ii Richard J | $229,900 | -- | |
| Riddle Richard J | $229,900 | -- | |
| Dunkerly Jay S | $141,000 | -- | |
| Dunkerly Jay S | $141,000 | -- |
Source: Public Records
Mortgage History
| Date | Status | Borrower | Loan Amount |
|---|---|---|---|
| Previous Owner | Dunkerly Jay S | $183,900 | |
| Previous Owner | Dunkerly Jay S | $46,000 |
Source: Public Records
Tax History
| Year | Tax Paid | Tax Assessment Tax Assessment Total Assessment is a certain percentage of the fair market value that is determined by local assessors to be the total taxable value of land and additions on the property. | Land | Improvement |
|---|---|---|---|---|
| 2025 | $7,435 | $563,700 | $81,500 | $482,200 |
| 2024 | $6,848 | $498,000 | $81,500 | $416,500 |
| 2023 | $6,558 | $457,300 | $70,900 | $386,400 |
| 2022 | $5,699 | $374,700 | $56,700 | $318,000 |
| 2021 | $3,753 | $230,500 | $45,400 | $185,100 |
| 2020 | $3,488 | $205,200 | $45,100 | $160,100 |
| 2019 | $3,460 | $192,200 | $39,300 | $152,900 |
| 2018 | $3,391 | $179,300 | $39,300 | $140,000 |
| 2017 | $3,191 | $166,000 | $39,300 | $126,700 |
| 2016 | $3,007 | $145,900 | $28,400 | $117,500 |
| 2015 | $2,928 | $145,900 | $28,400 | $117,500 |
| 2014 | $2,851 | $145,900 | $28,400 | $117,500 |
Source: Public Records
Map
Nearby Homes
- 47 Laurel St
- 15 Edward St
- 80 Mulberry St
- 1 Verdi Rd
- 145 Eastern Ave
- 29 Chilmark St
- 247 Shrewsbury St
- Lot 2 Ararat
- 21 Kendall St
- 26 Vinson St
- 91 Stanton St
- 256 Belmont St
- 25 Johnson St
- 6 Mount Vernon St Unit D
- 28 Adams St Unit 304
- 15 Breck St
- 5 State St Unit 1
- 13 Groton Place
- 5 Mcfarland Ct
- 23 Suffolk St
- 38 Merrifield St Unit 3
- 38 Merrifield St Unit 2
- 42 Merrifield St Unit 2
- 40 Merrifield St
- 34 Merrifield St
- 101 Gage St
- 28 Merrifield St
- 99 Gage St
- 29 Merrifield St
- 31 Merrifield St
- 39 Merrifield St
- 35 Merrifield St
- 24 Merrifield St
- 24 Merrifield St Unit 2
- 95 Gage St
- 43 Merrifield St
- 43 Merrifield St Unit 2
- 103 Gage St
- 27 Merrifield St
- 93 Gage St Unit 2
Your Personal Tour Guide
Ask me questions while you tour the home.