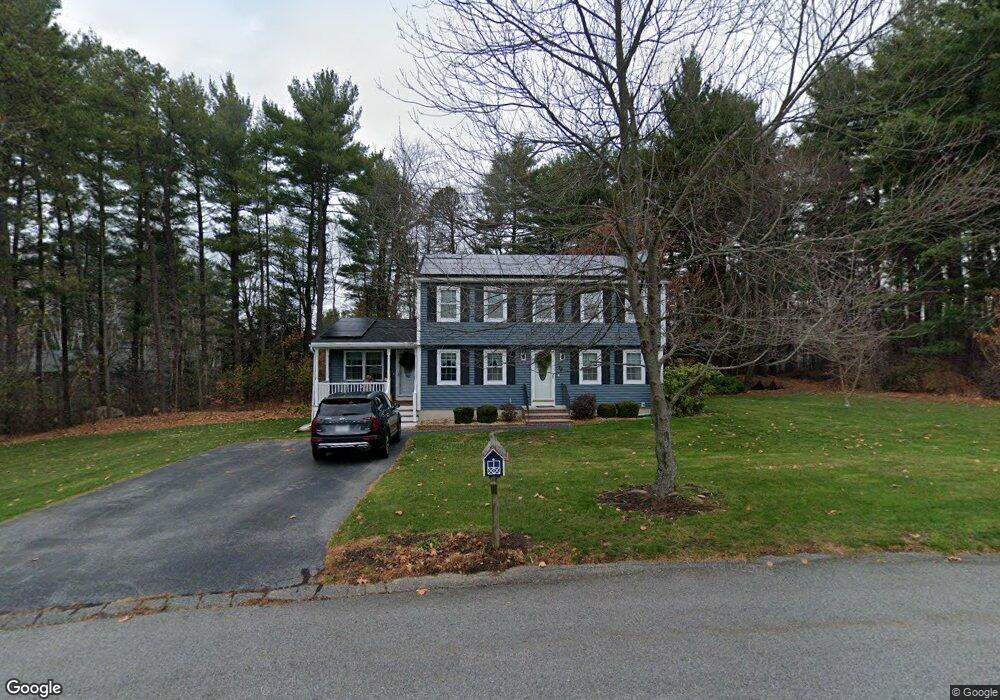
38 Paddock Ln Dracut, MA 01826
Estimated Value: $648,843 - $758,000
3
Beds
2
Baths
1,890
Sq Ft
$382/Sq Ft
Est. Value
About This Home
This home is located at 38 Paddock Ln, Dracut, MA 01826 and is currently estimated at $722,461, approximately $382 per square foot. 38 Paddock Ln is a home located in Middlesex County with nearby schools including Joseph A. Campbell Elementary School, Richardson Middle School, and Dracut Senior High School.
Ownership History
Date
Name
Owned For
Owner Type
Purchase Details
Closed on
Apr 12, 2025
Sold by
Cleghorn Barry S and Cleghorn Denise A
Bought by
Da and Bs Cleghorn
Current Estimated Value
Purchase Details
Closed on
Jun 5, 1990
Sold by
Obrien Co Inc
Bought by
Cleghorn Barry S
Purchase Details
Closed on
May 4, 1990
Sold by
Paddock Lane Inc
Bought by
Obrien Co Inc
Create a Home Valuation Report for This Property
The Home Valuation Report is an in-depth analysis detailing your home's value as well as a comparison with similar homes in the area
Home Values in the Area
Average Home Value in this Area
Purchase History
| Date | Buyer | Sale Price | Title Company |
|---|---|---|---|
| Da | -- | None Available | |
| Da | -- | None Available | |
| Cleghorn Barry S | $157,350 | -- | |
| Obrien Co Inc | $66,000 | -- |
Source: Public Records
Mortgage History
| Date | Status | Borrower | Loan Amount |
|---|---|---|---|
| Previous Owner | Obrien Co Inc | $238,000 | |
| Previous Owner | Obrien Co Inc | $200,000 | |
| Previous Owner | Obrien Co Inc | $185,000 |
Source: Public Records
Tax History
| Year | Tax Paid | Tax Assessment Tax Assessment Total Assessment is a certain percentage of the fair market value that is determined by local assessors to be the total taxable value of land and additions on the property. | Land | Improvement |
|---|---|---|---|---|
| 2025 | $5,872 | $580,200 | $255,700 | $324,500 |
| 2024 | $5,642 | $539,900 | $243,600 | $296,300 |
| 2023 | $5,580 | $481,900 | $212,000 | $269,900 |
| 2022 | $5,435 | $442,200 | $192,800 | $249,400 |
| 2021 | $5,243 | $403,000 | $175,100 | $227,900 |
| 2020 | $5,088 | $381,100 | $169,800 | $211,300 |
| 2019 | $4,879 | $354,800 | $161,700 | $193,100 |
| 2018 | $4,996 | $353,300 | $161,700 | $191,600 |
| 2017 | $4,592 | $353,300 | $161,700 | $191,600 |
| 2016 | $4,715 | $317,700 | $162,500 | $155,200 |
| 2015 | $4,582 | $306,900 | $162,500 | $144,400 |
| 2014 | $4,312 | $297,600 | $162,500 | $135,100 |
Source: Public Records
Map
Nearby Homes
- 785 Broadway Rd
- 46 Hopkins Cir
- 298 Salem Rd
- 302 Salem Rd
- 5 Bailey Rd
- 290 Salem Rd
- 51 Concord Rd
- 3 Oxyoke Dr
- 170 E Richardson Rd
- 30 Parker Rd
- 18 Stone Castle Dr Unit 76
- 2 Greybirch Rd
- 322 River Rd
- 71 N Lowell St
- 18 Ravens Bluff
- 2 Landmark Dr
- 84 Tellier Way
- 277 Loon Hill Rd
- 31 Varnum Ave
- 315 Broadway Rd Unit 1
Your Personal Tour Guide
Ask me questions while you tour the home.