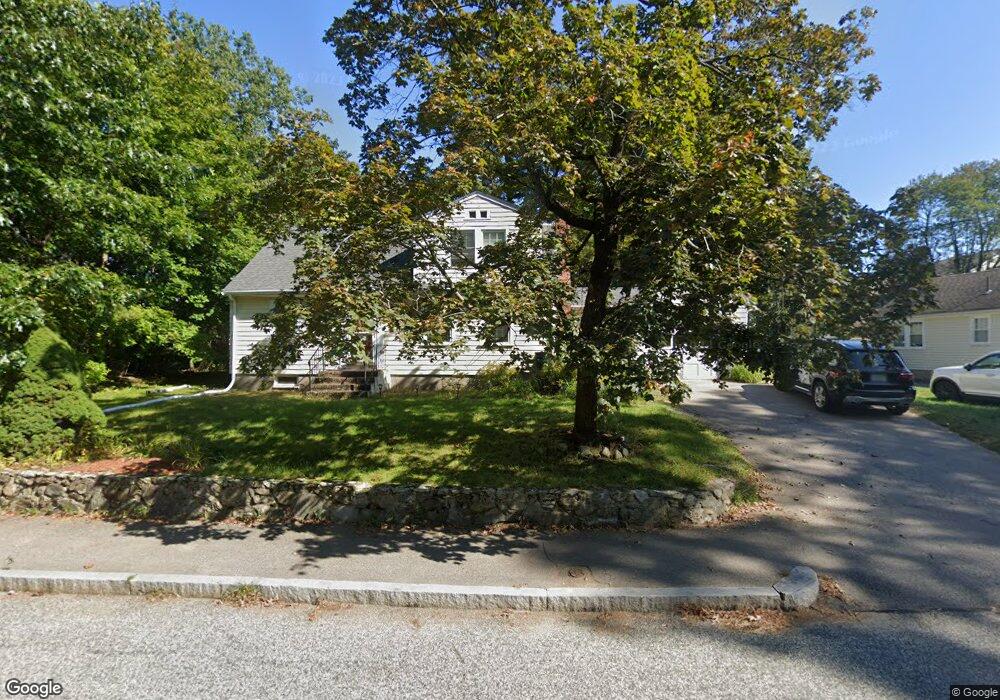
38 Parish Rd Needham Heights, MA 02494
Estimated Value: $1,067,000 - $1,237,000
4
Beds
2
Baths
1,670
Sq Ft
$700/Sq Ft
Est. Value
About This Home
This home is located at 38 Parish Rd, Needham Heights, MA 02494 and is currently estimated at $1,168,644, approximately $699 per square foot. 38 Parish Rd is a home located in Norfolk County with nearby schools including Sunita L. Williams Elementary School, High Rock Middle School, and Pollard Middle School.
Ownership History
Date
Name
Owned For
Owner Type
Purchase Details
Closed on
Dec 16, 2024
Sold by
Lewis Barry L and Dugan-Lewis Ann
Bought by
Lewis Barry L
Current Estimated Value
Purchase Details
Closed on
Aug 26, 2003
Sold by
Cohen Daniel B and Cohen Katherine S
Bought by
Lewis Barry L and Lewis Ann D
Purchase Details
Closed on
Jul 29, 1994
Sold by
Horan Steven T and Horan Heather A
Bought by
Cohen Daniel B and Cohen Katherine S
Create a Home Valuation Report for This Property
The Home Valuation Report is an in-depth analysis detailing your home's value as well as a comparison with similar homes in the area
Home Values in the Area
Average Home Value in this Area
Purchase History
| Date | Buyer | Sale Price | Title Company |
|---|---|---|---|
| Lewis Barry L | -- | None Available | |
| Lewis Barry L | -- | None Available | |
| Lewis Barry L | $503,000 | -- | |
| Cohen Daniel B | $225,000 | -- | |
| Lewis Barry L | $503,000 | -- | |
| Cohen Daniel B | $225,000 | -- |
Source: Public Records
Mortgage History
| Date | Status | Borrower | Loan Amount |
|---|---|---|---|
| Previous Owner | Cohen Daniel B | $417,000 | |
| Previous Owner | Cohen Daniel B | $35,000 |
Source: Public Records
Tax History Compared to Growth
Tax History
| Year | Tax Paid | Tax Assessment Tax Assessment Total Assessment is a certain percentage of the fair market value that is determined by local assessors to be the total taxable value of land and additions on the property. | Land | Improvement |
|---|---|---|---|---|
| 2025 | $10,138 | $956,400 | $747,800 | $208,600 |
| 2024 | $9,867 | $788,100 | $495,500 | $292,600 |
| 2023 | $9,944 | $762,600 | $495,500 | $267,100 |
| 2022 | $9,438 | $705,900 | $446,800 | $259,100 |
| 2021 | $9,198 | $705,900 | $446,800 | $259,100 |
| 2020 | $8,726 | $698,600 | $446,800 | $251,800 |
| 2019 | $8,123 | $655,600 | $406,600 | $249,000 |
| 2018 | $7,789 | $655,600 | $406,600 | $249,000 |
| 2017 | $7,419 | $624,000 | $406,600 | $217,400 |
| 2016 | $7,170 | $621,300 | $406,600 | $214,700 |
| 2015 | $7,014 | $621,300 | $406,600 | $214,700 |
| 2014 | $6,740 | $579,000 | $370,000 | $209,000 |
Source: Public Records
Map
Nearby Homes
- 34 Pershing Rd
- 3 Crescent Rd
- 35 Andrea Cir
- 445 Hillside Ave
- 379 Hunnewell St Unit 379
- 400 Hunnewell St Unit 103
- 12 Hill St
- 7 Avery St
- 98 Hunnewell St
- 443 Central Ave
- 556 Webster St
- 36 Davenport Rd
- 345 Central Ave
- 78 Hunnewell St
- 29 Tolman St
- 62 Evelyn Rd
- 310 Oakland St
- 41 Lee Rd
- 46 Lincoln Rd
- 71 School St