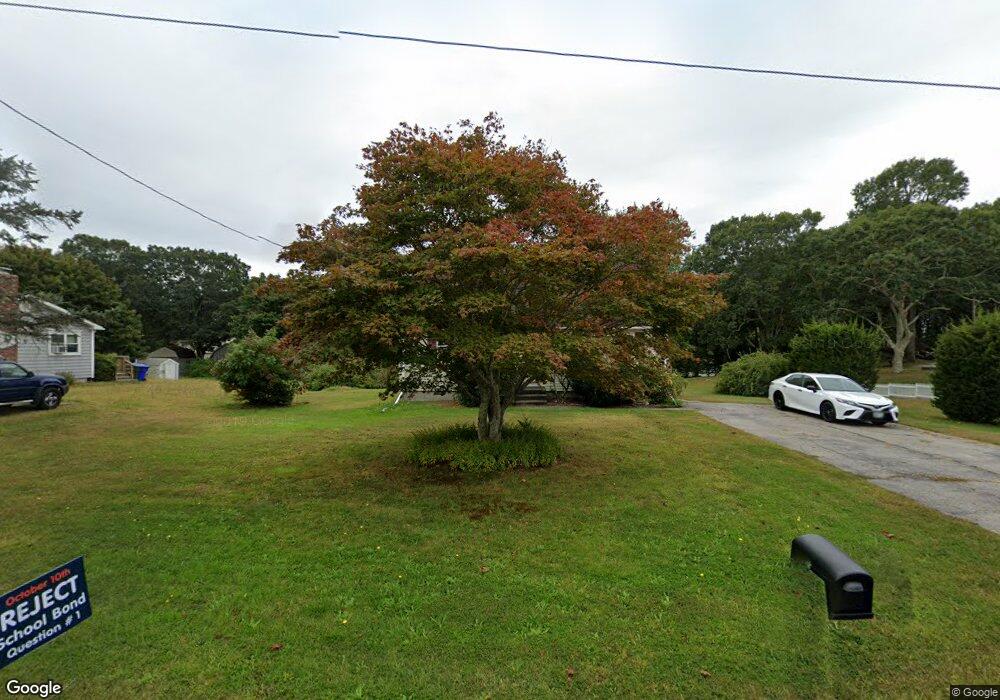
38 Quannacut Rd Westerly, RI 02891
Estimated Value: $573,801 - $729,000
3
Beds
2
Baths
1,638
Sq Ft
$404/Sq Ft
Est. Value
About This Home
This home is located at 38 Quannacut Rd, Westerly, RI 02891 and is currently estimated at $661,200, approximately $403 per square foot. 38 Quannacut Rd is a home located in Washington County with nearby schools including Westerly High School.
Ownership History
Date
Name
Owned For
Owner Type
Purchase Details
Closed on
Jun 1, 1999
Sold by
Albertson Lori D
Bought by
Waddington Sarah E
Current Estimated Value
Purchase Details
Closed on
Oct 5, 1992
Sold by
Murray William J and Murray Barbara M
Bought by
Albertson Howard T and Albertson Lori D
Create a Home Valuation Report for This Property
The Home Valuation Report is an in-depth analysis detailing your home's value as well as a comparison with similar homes in the area
Home Values in the Area
Average Home Value in this Area
Purchase History
| Date | Buyer | Sale Price | Title Company |
|---|---|---|---|
| Waddington Sarah E | $126,500 | -- | |
| Albertson Howard T | $115,000 | -- |
Source: Public Records
Mortgage History
| Date | Status | Borrower | Loan Amount |
|---|---|---|---|
| Open | Albertson Howard T | $360,000 | |
| Closed | Albertson Howard T | $344,750 | |
| Closed | Albertson Howard T | $225,000 | |
| Closed | Albertson Howard T | $183,000 |
Source: Public Records
Tax History Compared to Growth
Tax History
| Year | Tax Paid | Tax Assessment Tax Assessment Total Assessment is a certain percentage of the fair market value that is determined by local assessors to be the total taxable value of land and additions on the property. | Land | Improvement |
|---|---|---|---|---|
| 2025 | $3,249 | $456,900 | $186,100 | $270,800 |
| 2024 | $3,652 | $372,300 | $132,900 | $239,400 |
| 2023 | $3,530 | $366,900 | $132,900 | $234,000 |
| 2022 | $3,508 | $366,900 | $132,900 | $234,000 |
| 2021 | $3,406 | $295,700 | $115,500 | $180,200 |
| 2020 | $3,344 | $295,700 | $115,500 | $180,200 |
| 2019 | $3,312 | $295,700 | $115,500 | $180,200 |
| 2018 | $2,713 | $228,400 | $115,500 | $112,900 |
| 2017 | $2,647 | $228,400 | $115,500 | $112,900 |
| 2016 | $2,668 | $228,400 | $115,500 | $112,900 |
| 2015 | $2,589 | $239,300 | $123,500 | $115,800 |
| 2014 | $2,546 | $239,300 | $123,500 | $115,800 |
Source: Public Records
Map
Nearby Homes
- 11 Bucks Trail
- 14 Piezzo Dr
- 30 Clifford Dr
- 33 Stuart St
- 5 Robin Hollow Ln
- 2 Belle Rose Dr Unit A
- 17 Plateau Rd
- 10 Morris Rd
- 342 Post Rd
- 15 Breach Dr
- 346 Post Rd
- 7 Fenway Rd
- 597 Atlantic Ave
- 54 Sherwood Dr
- 12 Fallon Trail
- 470 Atlantic Ave
- 118 Dunns Corner Rd
- 446 Atlantic Ave
- 432 Atlantic Ave
- 137 Cove Point Rd E