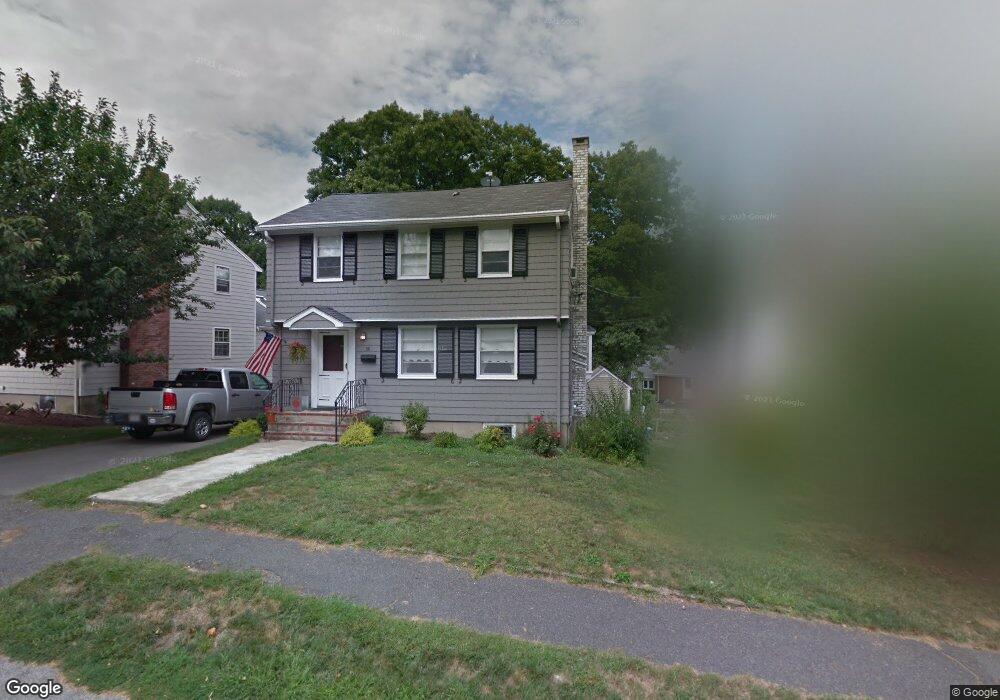
38 Rose St Milton, MA 02186
Estimated Value: $910,000 - $1,101,000
4
Beds
2
Baths
1,915
Sq Ft
$519/Sq Ft
Est. Value
About This Home
This home is located at 38 Rose St, Milton, MA 02186 and is currently estimated at $993,751, approximately $518 per square foot. 38 Rose St is a home located in Norfolk County with nearby schools including Milton High School, St. Agatha School, and Milton Academy.
Ownership History
Date
Name
Owned For
Owner Type
Purchase Details
Closed on
Apr 23, 2020
Sold by
Mantville Brian M and Mantville Nicole M
Bought by
Mantville Ft
Current Estimated Value
Purchase Details
Closed on
Mar 20, 2006
Sold by
Martin Barbara C and Mullen Marion T
Bought by
Mantville Brian M and Mantville Nicole M
Home Financials for this Owner
Home Financials are based on the most recent Mortgage that was taken out on this home.
Original Mortgage
$310,000
Interest Rate
6.27%
Mortgage Type
Purchase Money Mortgage
Create a Home Valuation Report for This Property
The Home Valuation Report is an in-depth analysis detailing your home's value as well as a comparison with similar homes in the area
Purchase History
| Date | Buyer | Sale Price | Title Company |
|---|---|---|---|
| Mantville Ft | -- | None Available | |
| Mantville Brian M | $455,000 | -- |
Source: Public Records
Mortgage History
| Date | Status | Borrower | Loan Amount |
|---|---|---|---|
| Previous Owner | Mantville Brian M | $310,000 |
Source: Public Records
Tax History
| Year | Tax Paid | Tax Assessment Tax Assessment Total Assessment is a certain percentage of the fair market value that is determined by local assessors to be the total taxable value of land and additions on the property. | Land | Improvement |
|---|---|---|---|---|
| 2025 | $9,108 | $821,300 | $508,400 | $312,900 |
| 2024 | $8,774 | $803,500 | $484,200 | $319,300 |
| 2023 | $8,716 | $764,600 | $461,200 | $303,400 |
| 2022 | $8,693 | $697,100 | $461,200 | $235,900 |
| 2021 | $7,769 | $591,700 | $367,100 | $224,600 |
| 2020 | $7,497 | $571,400 | $351,800 | $219,600 |
| 2019 | $7,310 | $554,600 | $341,500 | $213,100 |
| 2018 | $6,962 | $504,100 | $293,600 | $210,500 |
| 2017 | $6,510 | $480,100 | $279,600 | $200,500 |
| 2016 | $6,060 | $448,900 | $252,900 | $196,000 |
| 2015 | $5,916 | $424,400 | $233,000 | $191,400 |
Source: Public Records
Map
Nearby Homes
- 40 Dean Rd
- 207 Pleasant St
- 111-113 Pleasant St
- 97 Pleasant St
- 88 Patricia Dr
- 403405 Reedsdale Rd
- 46 Century Ln
- 6 Brewster Rd
- 1185 Brook Rd
- 84 Gardiner Rd
- 397 Adams St
- 400 Adams St Unit A
- 260 Canton Ave
- 161 Sassamon Ave
- 85 Forbes Rd
- 440 Granite Ave Unit 201
- 114 Willard St Unit 4
- 424 Brook Rd
- 52 California Ave
- 41 Wallace Rd
Your Personal Tour Guide
Ask me questions while you tour the home.