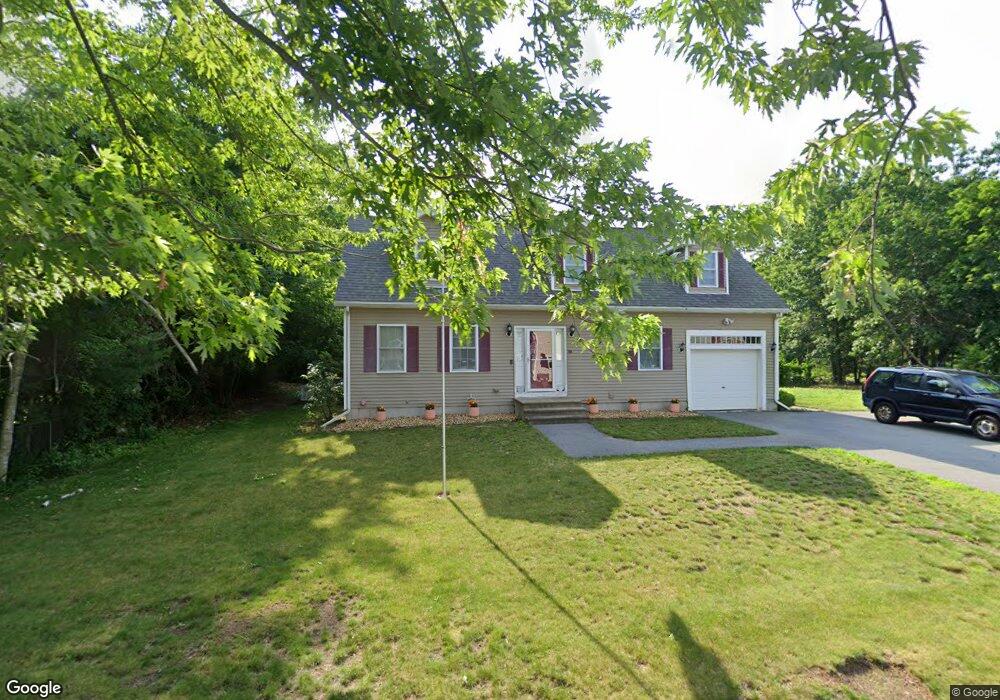
38 Shore Dr Salem, NH 03079
Arlington Pond NeighborhoodEstimated Value: $614,000 - $722,000
3
Beds
3
Baths
1,893
Sq Ft
$353/Sq Ft
Est. Value
About This Home
This home is located at 38 Shore Dr, Salem, NH 03079 and is currently estimated at $667,710, approximately $352 per square foot. 38 Shore Dr is a home located in Rockingham County with nearby schools including North Salem Elementary School, Woodbury School, and Salem High School.
Ownership History
Date
Name
Owned For
Owner Type
Purchase Details
Closed on
Oct 20, 2010
Sold by
Kln Construction Co
Bought by
Martelle Gloria C and Martelle Dawn-Ell
Current Estimated Value
Home Financials for this Owner
Home Financials are based on the most recent Mortgage that was taken out on this home.
Original Mortgage
$80,000
Interest Rate
4.37%
Mortgage Type
Purchase Money Mortgage
Purchase Details
Closed on
Jan 23, 2008
Sold by
Clivio Robert J and Wells Fargo Bank Na
Bought by
Wells Fargo Bank Na
Purchase Details
Closed on
Mar 31, 2006
Sold by
Lynch Jeffrey R and Lynch Lana
Bought by
Clivio Robert J and Clivio Lana M
Home Financials for this Owner
Home Financials are based on the most recent Mortgage that was taken out on this home.
Original Mortgage
$191,250
Interest Rate
6.32%
Mortgage Type
Purchase Money Mortgage
Purchase Details
Closed on
Aug 12, 1998
Sold by
Gorgol Marjorie L
Bought by
Lynch Jeffrey R
Create a Home Valuation Report for This Property
The Home Valuation Report is an in-depth analysis detailing your home's value as well as a comparison with similar homes in the area
Home Values in the Area
Average Home Value in this Area
Purchase History
| Date | Buyer | Sale Price | Title Company |
|---|---|---|---|
| Martelle Gloria C | $295,000 | -- | |
| Wells Fargo Bank Na | $140,000 | -- | |
| Clivio Robert J | $225,000 | -- | |
| Lynch Jeffrey R | $59,900 | -- |
Source: Public Records
Mortgage History
| Date | Status | Borrower | Loan Amount |
|---|---|---|---|
| Open | Lynch Jeffrey R | $78,000 | |
| Closed | Lynch Jeffrey R | $23,000 | |
| Closed | Lynch Jeffrey R | $80,000 | |
| Previous Owner | Lynch Jeffrey R | $191,250 |
Source: Public Records
Tax History Compared to Growth
Tax History
| Year | Tax Paid | Tax Assessment Tax Assessment Total Assessment is a certain percentage of the fair market value that is determined by local assessors to be the total taxable value of land and additions on the property. | Land | Improvement |
|---|---|---|---|---|
| 2024 | $8,615 | $489,500 | $148,300 | $341,200 |
| 2023 | $8,302 | $489,500 | $148,300 | $341,200 |
| 2022 | $7,856 | $489,500 | $148,300 | $341,200 |
| 2021 | $7,822 | $489,500 | $148,300 | $341,200 |
| 2020 | $7,106 | $322,700 | $106,000 | $216,700 |
| 2019 | $7,093 | $322,700 | $106,000 | $216,700 |
| 2018 | $6,974 | $322,700 | $106,000 | $216,700 |
| 2017 | $6,725 | $322,700 | $106,000 | $216,700 |
| 2016 | $6,593 | $322,700 | $106,000 | $216,700 |
| 2015 | $6,282 | $293,700 | $107,500 | $186,200 |
| 2014 | $6,106 | $293,700 | $107,500 | $186,200 |
| 2013 | $6,009 | $293,700 | $107,500 | $186,200 |
Source: Public Records
Map
Nearby Homes