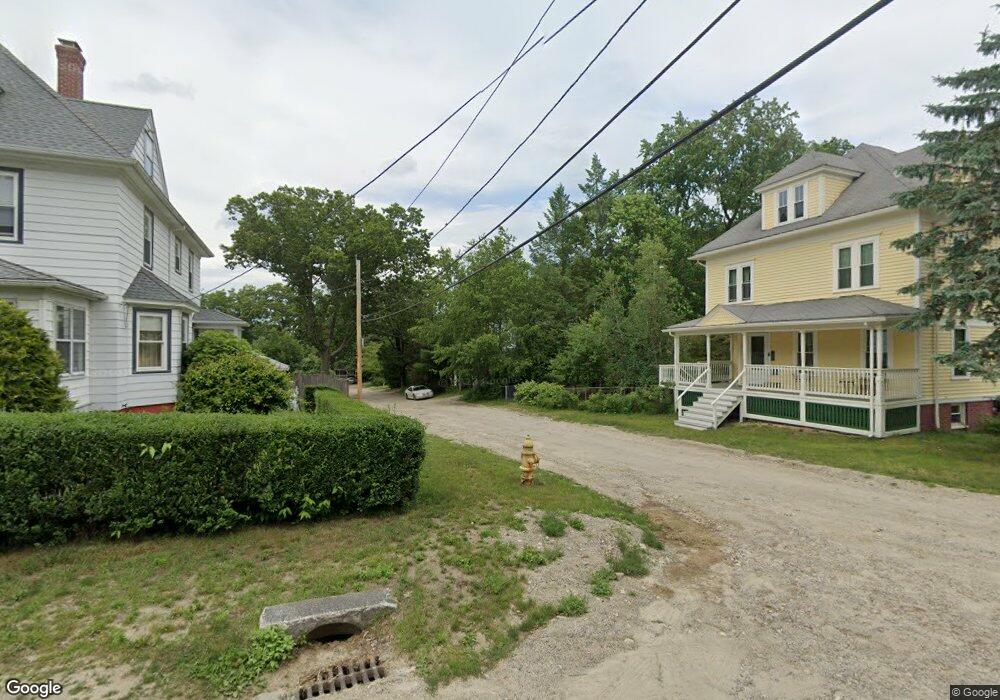
38 Wayne St Worcester, MA 01603
Webster Square NeighborhoodEstimated Value: $415,000 - $616,429
4
Beds
3
Baths
2,744
Sq Ft
$188/Sq Ft
Est. Value
About This Home
This home is located at 38 Wayne St, Worcester, MA 01603 and is currently estimated at $517,107, approximately $188 per square foot. 38 Wayne St is a home located in Worcester County with nearby schools including Gates Lane, Jacob Hiatt Magnet School, and Chandler Magnet.
Ownership History
Date
Name
Owned For
Owner Type
Purchase Details
Closed on
May 21, 2018
Sold by
Wayne Street Llc
Bought by
Forson Joseph and Forson Maria
Current Estimated Value
Home Financials for this Owner
Home Financials are based on the most recent Mortgage that was taken out on this home.
Original Mortgage
$376,000
Outstanding Balance
$330,845
Interest Rate
5.4%
Mortgage Type
Adjustable Rate Mortgage/ARM
Estimated Equity
$186,262
Purchase Details
Closed on
May 31, 2013
Sold by
Forson Joseph M and Forson Maria J
Bought by
Wayne Street Llc
Home Financials for this Owner
Home Financials are based on the most recent Mortgage that was taken out on this home.
Original Mortgage
$376,000
Interest Rate
3.45%
Mortgage Type
Stand Alone Refi Refinance Of Original Loan
Create a Home Valuation Report for This Property
The Home Valuation Report is an in-depth analysis detailing your home's value as well as a comparison with similar homes in the area
Home Values in the Area
Average Home Value in this Area
Purchase History
| Date | Buyer | Sale Price | Title Company |
|---|---|---|---|
| Forson Joseph | -- | -- | |
| Wayne Street Llc | -- | -- |
Source: Public Records
Mortgage History
| Date | Status | Borrower | Loan Amount |
|---|---|---|---|
| Open | Forson Joseph | $376,000 | |
| Previous Owner | Wayne Street Llc | $376,000 |
Source: Public Records
Tax History
| Year | Tax Paid | Tax Assessment Tax Assessment Total Assessment is a certain percentage of the fair market value that is determined by local assessors to be the total taxable value of land and additions on the property. | Land | Improvement |
|---|---|---|---|---|
| 2025 | $7,790 | $590,600 | $97,800 | $492,800 |
| 2024 | $7,692 | $559,400 | $97,800 | $461,600 |
| 2023 | $7,529 | $525,000 | $85,000 | $440,000 |
| 2022 | $7,100 | $466,800 | $68,000 | $398,800 |
| 2021 | $7,191 | $441,700 | $54,400 | $387,300 |
| 2020 | $6,948 | $408,700 | $54,000 | $354,700 |
| 2019 | $6,671 | $370,600 | $47,200 | $323,400 |
| 2018 | $6,567 | $347,300 | $47,200 | $300,100 |
| 2017 | $6,523 | $339,400 | $47,200 | $292,200 |
| 2016 | $6,696 | $324,900 | $33,400 | $291,500 |
| 2015 | $6,521 | $324,900 | $33,400 | $291,500 |
| 2014 | $6,349 | $324,900 | $33,400 | $291,500 |
Source: Public Records
Map
Nearby Homes
- 23 Lakewood St
- 31 B Gates Rd Unit 22R
- 2 Montague St
- 25 Wyola Dr
- 114 Lovell St
- 5 Stoneland Rd
- 26 Sylvan St
- 19 Oliver St
- 12 Stoneland Rd
- 47 Birch St
- 5 Freeland Terrace
- 34 Rosslare Dr Unit 108
- 128 Wildwood Ave
- 28 Richards St
- 57 1st St
- 103 Henshaw St
- 54 Richards St
- 56 Richards St
- 52 Richards St
- 78 Downing St
Your Personal Tour Guide
Ask me questions while you tour the home.