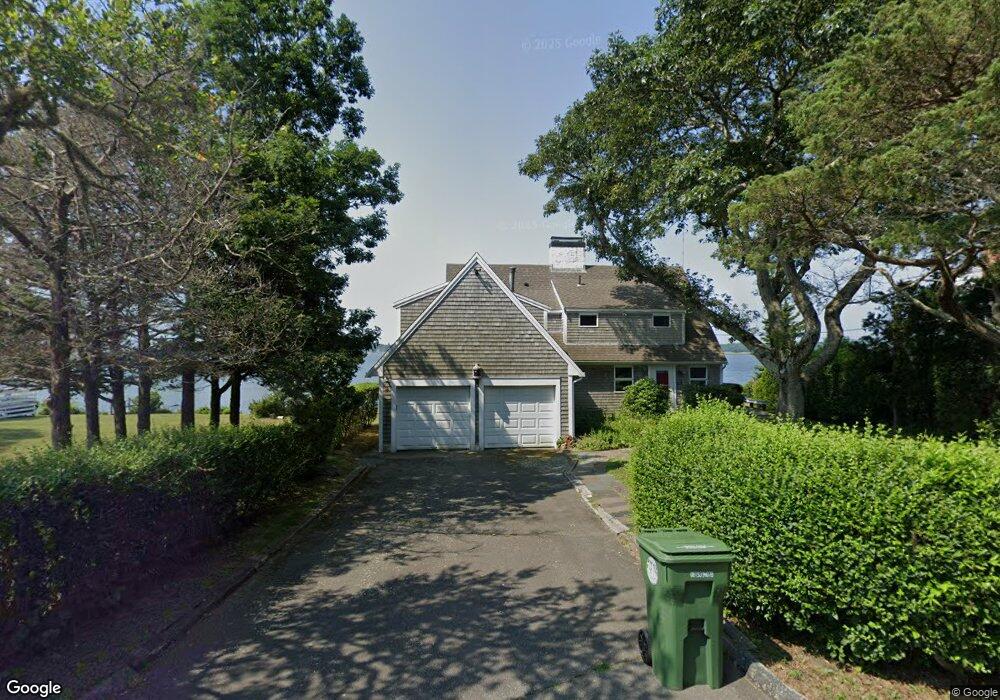
38 West Ave Marion, MA 02738
Estimated Value: $1,729,000 - $2,683,000
4
Beds
3
Baths
2,888
Sq Ft
$762/Sq Ft
Est. Value
About This Home
This home is located at 38 West Ave, Marion, MA 02738 and is currently estimated at $2,200,633, approximately $761 per square foot. 38 West Ave is a home located in Plymouth County with nearby schools including Old Rochester Regional High School.
Ownership History
Date
Name
Owned For
Owner Type
Purchase Details
Closed on
Jun 14, 2021
Sold by
Grable-Esposito Phyllis and Grable Ian
Bought by
Ecg Marion House Llc
Current Estimated Value
Purchase Details
Closed on
Dec 7, 2020
Sold by
38 West Avenue Rt and Grable
Bought by
Grable-Esposito Phyllis and Grable Ian
Purchase Details
Closed on
Nov 8, 2012
Sold by
Grable Cecily A
Bought by
38 West Avenue Rt and Grable
Purchase Details
Closed on
Aug 19, 1994
Sold by
Blanchard Harold A and Blanchard Joanne D
Bought by
Sasserson Teressa M and Sasserson Jeffrey L
Home Financials for this Owner
Home Financials are based on the most recent Mortgage that was taken out on this home.
Original Mortgage
$169,000
Interest Rate
8.61%
Mortgage Type
Purchase Money Mortgage
Purchase Details
Closed on
Jun 26, 1981
Bought by
38 West Ave Rt
Create a Home Valuation Report for This Property
The Home Valuation Report is an in-depth analysis detailing your home's value as well as a comparison with similar homes in the area
Home Values in the Area
Average Home Value in this Area
Purchase History
| Date | Buyer | Sale Price | Title Company |
|---|---|---|---|
| Ecg Marion House Llc | -- | None Available | |
| Grable-Esposito Phyllis | -- | None Available | |
| 38 West Avenue Rt | -- | -- | |
| Sasserson Teressa M | $178,000 | -- | |
| 38 West Ave Rt | $219,000 | -- |
Source: Public Records
Mortgage History
| Date | Status | Borrower | Loan Amount |
|---|---|---|---|
| Previous Owner | 38 West Ave Rt | $169,000 |
Source: Public Records
Tax History Compared to Growth
Tax History
| Year | Tax Paid | Tax Assessment Tax Assessment Total Assessment is a certain percentage of the fair market value that is determined by local assessors to be the total taxable value of land and additions on the property. | Land | Improvement |
|---|---|---|---|---|
| 2025 | $19,525 | $2,094,947 | $1,618,947 | $476,000 |
| 2024 | $19,482 | $2,103,934 | $1,702,134 | $401,800 |
| 2023 | $18,469 | $1,956,453 | $1,580,553 | $375,900 |
| 2022 | $19,960 | $1,839,637 | $1,454,737 | $384,900 |
| 2021 | $18,836 | $1,663,965 | $1,296,865 | $367,100 |
| 2020 | $15,828 | $1,352,800 | $1,035,300 | $317,500 |
| 2019 | $13,899 | $1,260,100 | $942,600 | $317,500 |
| 2018 | $14,862 | $1,298,000 | $1,019,900 | $278,100 |
| 2017 | $14,810 | $1,298,000 | $1,019,900 | $278,100 |
| 2016 | $14,560 | $1,287,400 | $1,019,900 | $267,500 |
| 2015 | $14,405 | $1,296,600 | $997,200 | $299,400 |
Source: Public Records
Map
Nearby Homes