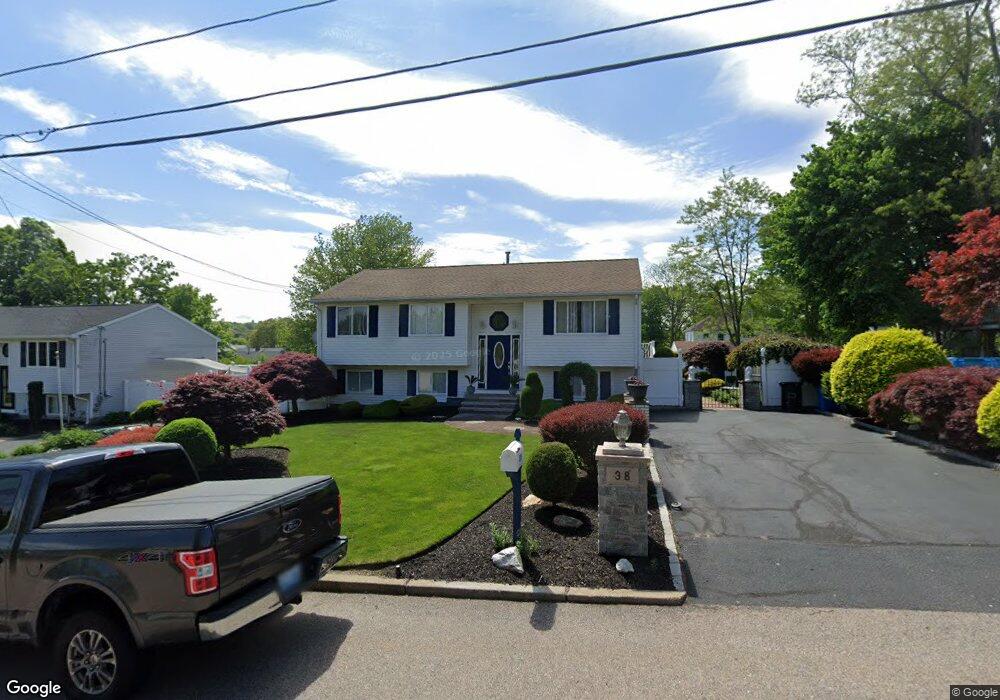
38 Wightman St West Warwick, RI 02893
Lippitt-Harris NeighborhoodEstimated Value: $431,000 - $524,000
4
Beds
2
Baths
2,100
Sq Ft
$219/Sq Ft
Est. Value
About This Home
This home is located at 38 Wightman St, West Warwick, RI 02893 and is currently estimated at $459,799, approximately $218 per square foot. 38 Wightman St is a home located in Kent County with nearby schools including West Warwick High School, St Joseph School, and Islamic School of Rhode Island.
Ownership History
Date
Name
Owned For
Owner Type
Purchase Details
Closed on
Oct 3, 2011
Sold by
Chacon Luis F and Chacon Maria G
Bought by
Chacon Luis F
Current Estimated Value
Home Financials for this Owner
Home Financials are based on the most recent Mortgage that was taken out on this home.
Original Mortgage
$165,000
Outstanding Balance
$112,807
Interest Rate
4.15%
Estimated Equity
$346,992
Purchase Details
Closed on
May 27, 2005
Sold by
Andrade Antero C and Andrade Oriana M
Bought by
Chacon Luis and Chacon Maria
Purchase Details
Closed on
Aug 2, 1994
Sold by
Bruce L Hopkins Constr
Bought by
Andrade Antero C and Andrade Corianna
Create a Home Valuation Report for This Property
The Home Valuation Report is an in-depth analysis detailing your home's value as well as a comparison with similar homes in the area
Home Values in the Area
Average Home Value in this Area
Purchase History
| Date | Buyer | Sale Price | Title Company |
|---|---|---|---|
| Chacon Luis F | -- | -- | |
| Chacon Luis | $320,000 | -- | |
| Andrade Antero C | $77,500 | -- |
Source: Public Records
Mortgage History
| Date | Status | Borrower | Loan Amount |
|---|---|---|---|
| Open | Andrade Antero C | $165,000 | |
| Previous Owner | Andrade Antero C | $120,000 |
Source: Public Records
Tax History
| Year | Tax Paid | Tax Assessment Tax Assessment Total Assessment is a certain percentage of the fair market value that is determined by local assessors to be the total taxable value of land and additions on the property. | Land | Improvement |
|---|---|---|---|---|
| 2025 | $5,565 | $389,400 | $86,500 | $302,900 |
| 2024 | $5,667 | $303,200 | $70,600 | $232,600 |
| 2023 | $5,555 | $303,200 | $70,600 | $232,600 |
| 2022 | $5,470 | $303,200 | $70,600 | $232,600 |
| 2021 | $5,571 | $242,200 | $59,400 | $182,800 |
| 2020 | $5,571 | $242,200 | $59,400 | $182,800 |
| 2019 | $7,101 | $242,200 | $59,400 | $182,800 |
| 2018 | $4,982 | $183,300 | $56,800 | $126,500 |
| 2017 | $4,823 | $183,300 | $56,800 | $126,500 |
| 2016 | $4,736 | $183,300 | $56,800 | $126,500 |
| 2015 | $4,561 | $175,700 | $56,800 | $118,900 |
| 2014 | $4,461 | $175,700 | $56,800 | $118,900 |
Source: Public Records
Map
Nearby Homes
Your Personal Tour Guide
Ask me questions while you tour the home.