Estimated Value: $642,106 - $784,000
2
Beds
1
Bath
792
Sq Ft
$932/Sq Ft
Est. Value
About This Home
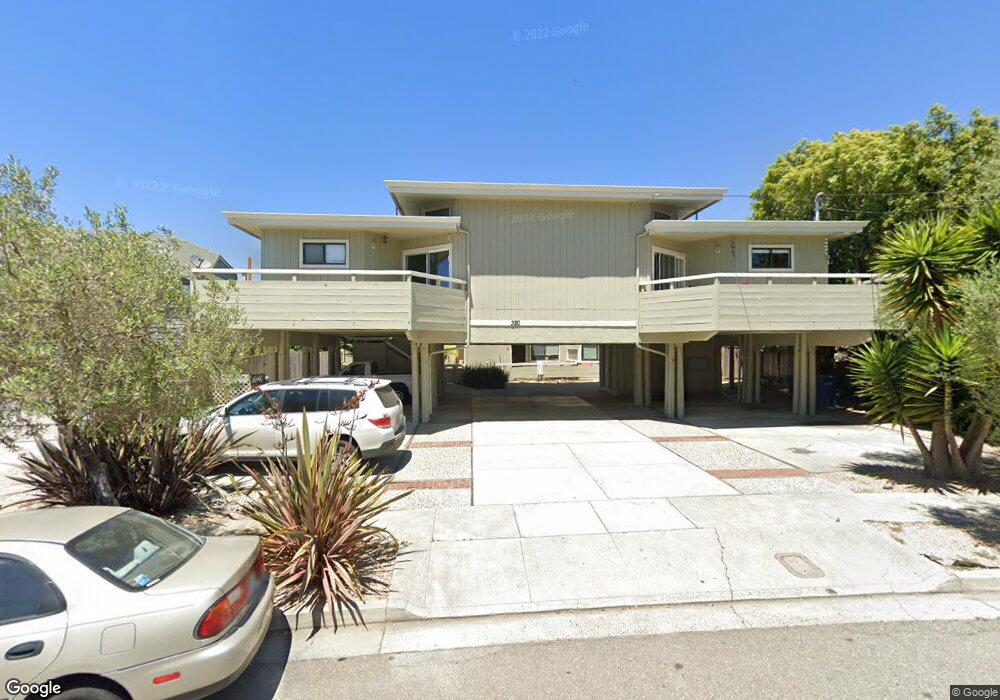
This home is located at 380 Sea Ridge Rd Unit C, Aptos, CA 95003 and is currently estimated at $738,527, approximately $932 per square foot. 380 Sea Ridge Rd Unit C is a home located in Santa Cruz County with nearby schools including Mar Vista Elementary School, Aptos Junior High School, and Aptos High School.
Ownership History
Date
Name
Owned For
Owner Type
Purchase Details
Closed on
Oct 3, 2002
Sold by
Dunn Kevin J
Bought by
Dunn Kevin James
Current Estimated Value
Home Financials for this Owner
Home Financials are based on the most recent Mortgage that was taken out on this home.
Original Mortgage
$50,000
Interest Rate
6.17%
Purchase Details
Closed on
Nov 16, 1994
Sold by
Orol Brian S and Orol Deborah
Bought by
Dunn Kevin J
Home Financials for this Owner
Home Financials are based on the most recent Mortgage that was taken out on this home.
Original Mortgage
$92,000
Interest Rate
9.1%
Purchase Details
Closed on
Dec 7, 1993
Sold by
Orol Brian S
Bought by
Orol Brian S and Orol Deborah
Home Financials for this Owner
Home Financials are based on the most recent Mortgage that was taken out on this home.
Original Mortgage
$72,000
Interest Rate
7.24%
Create a Home Valuation Report for This Property
The Home Valuation Report is an in-depth analysis detailing your home's value as well as a comparison with similar homes in the area
Home Values in the Area
Average Home Value in this Area
Purchase History
| Date | Buyer | Sale Price | Title Company |
|---|---|---|---|
| Dunn Kevin James | -- | First American Title Co | |
| Dunn Kevin J | $115,000 | Santa Cruz Title Company | |
| Orol Brian S | -- | First American Title Ins Co |
Source: Public Records
Mortgage History
| Date | Status | Borrower | Loan Amount |
|---|---|---|---|
| Closed | Dunn Kevin James | $50,000 | |
| Closed | Dunn Kevin J | $92,000 | |
| Previous Owner | Orol Brian S | $72,000 |
Source: Public Records
Tax History Compared to Growth
Tax History
| Year | Tax Paid | Tax Assessment Tax Assessment Total Assessment is a certain percentage of the fair market value that is determined by local assessors to be the total taxable value of land and additions on the property. | Land | Improvement |
|---|---|---|---|---|
| 2025 | $3,224 | $193,174 | $96,587 | $96,587 |
| 2023 | $3,117 | $185,672 | $92,836 | $92,836 |
| 2022 | $3,018 | $182,032 | $91,016 | $91,016 |
| 2021 | $2,827 | $178,464 | $89,232 | $89,232 |
| 2020 | $2,768 | $176,634 | $88,317 | $88,317 |
| 2019 | $2,715 | $173,170 | $86,585 | $86,585 |
| 2018 | $2,632 | $169,774 | $84,887 | $84,887 |
| 2017 | $2,594 | $166,446 | $83,223 | $83,223 |
| 2016 | $2,518 | $163,182 | $81,591 | $81,591 |
| 2015 | $2,448 | $160,730 | $80,365 | $80,365 |
| 2014 | $2,381 | $157,582 | $78,791 | $78,791 |
Source: Public Records
Map
Nearby Homes
- 220 Mar Vista Dr Unit 11
- 423 Hillcrest Dr
- 220 Mar Vista #41 Dr Unit 41
- 261 Sea Ridge Rd Unit 3
- 417 Seacliff Dr
- 297 Bonefish Ct
- 516 Gertrude Ave
- 6 Primrose St Unit 6
- 34 Primrose St Unit 34
- 21 Primrose St Unit 21
- 217 Valencia Ave
- 87 Leawood St Unit 87
- 2832 Casa de Vida Dr
- 254 Center Ave
- 745 Las Olas Dr
- 129 Santa Cruz Ave
- 7245 Lotus Way
- 7547 Arden Way
- 106 Madeline Dr
- 2784 Borregas Dr
- 380 Sea Ridge Rd
- 380 Sea Ridge Rd Unit A
- 380 Sea Ridge Rd Unit E
- 380 Sea Ridge Rd Unit D
- 390 Sea Ridge Rd Unit A
- 372 Sea Ridge Rd Unit 2
- 372 Sea Ridge Rd Unit 1
- 372 Sea Ridge Rd
- 372 Sea Ridge Rd Unit 4
- 372 Sea Ridge Rd Unit 5
- 396 Sea Ridge Rd Unit 1
- 399 Sea Ridge Rd Unit C
- 102 Lloyd Ct
- 0 Mar Vista Dr
- 121 Lloyd Ct
- 121 Lloyd Ct Unit 1
- 385 Sea Ridge Rd
- 104 Lloyd Ct
- 106 Lloyd Ct
- 114 Lloyd Ct