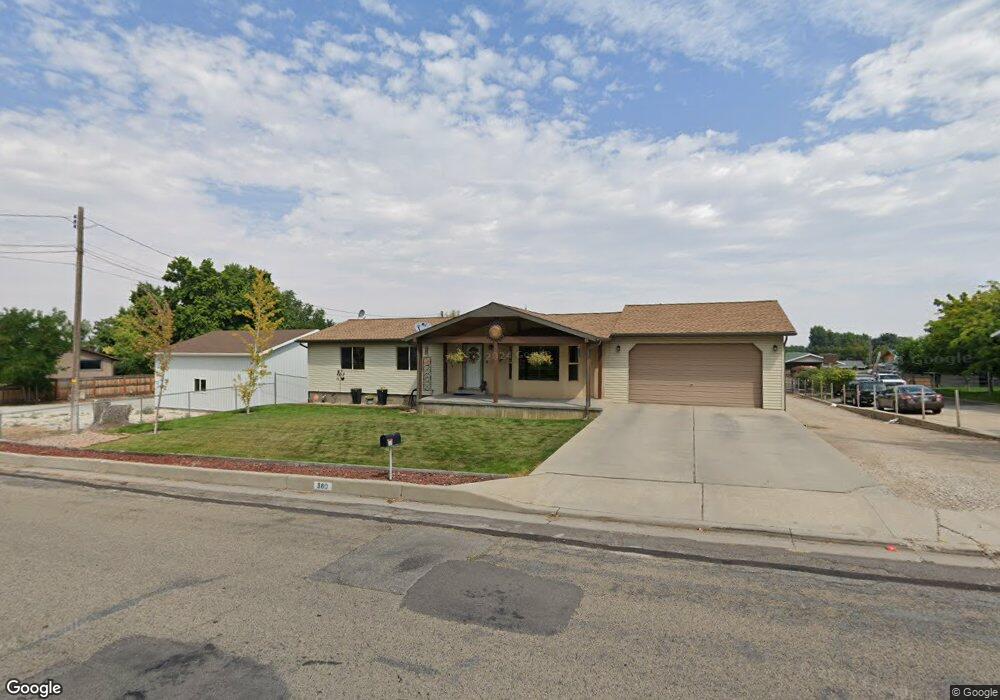
380 W 700 S Tooele, UT 84074
Estimated Value: $387,000 - $437,000
2
Beds
1
Bath
1,614
Sq Ft
$256/Sq Ft
Est. Value
About This Home
This home is located at 380 W 700 S, Tooele, UT 84074 and is currently estimated at $413,048, approximately $255 per square foot. 380 W 700 S is a home located in Tooele County with nearby schools including West Elementary School, Northlake Elementary School, and Tooele Junior High School.
Ownership History
Date
Name
Owned For
Owner Type
Purchase Details
Closed on
Sep 27, 2021
Sold by
Vonmanowski Silke
Bought by
Vonmanowski Silke and Miner Ged
Current Estimated Value
Home Financials for this Owner
Home Financials are based on the most recent Mortgage that was taken out on this home.
Original Mortgage
$120,000
Interest Rate
2.8%
Mortgage Type
New Conventional
Purchase Details
Closed on
Aug 17, 2021
Sold by
Vonmanowski Gary Von
Bought by
Vonmanowski Silke Von
Home Financials for this Owner
Home Financials are based on the most recent Mortgage that was taken out on this home.
Original Mortgage
$120,000
Interest Rate
2.8%
Mortgage Type
New Conventional
Purchase Details
Closed on
Apr 28, 2018
Sold by
Vonvonmanowski Gary Von and Manowski Silke Von
Bought by
Vonvonmanowski Gary Von and Manowski Silke Von
Purchase Details
Closed on
Jul 27, 2017
Sold by
Vonvonmanowski Gary Von
Bought by
Vonvonmanowski Gary Von and Manowski Silke Von
Home Financials for this Owner
Home Financials are based on the most recent Mortgage that was taken out on this home.
Original Mortgage
$211,111
Interest Rate
3.91%
Mortgage Type
New Conventional
Purchase Details
Closed on
Sep 15, 2015
Sold by
Blood Marcus
Bought by
Blood Marcus and Blood Sarah
Home Financials for this Owner
Home Financials are based on the most recent Mortgage that was taken out on this home.
Original Mortgage
$197,790
Interest Rate
3.87%
Mortgage Type
FHA
Purchase Details
Closed on
Aug 16, 2011
Sold by
Blood April
Bought by
Blood Marcus
Purchase Details
Closed on
Dec 8, 2010
Sold by
Blood Marcus M
Bought by
Blood Marcus and Blood April
Home Financials for this Owner
Home Financials are based on the most recent Mortgage that was taken out on this home.
Original Mortgage
$210,289
Interest Rate
4.87%
Mortgage Type
FHA
Purchase Details
Closed on
Jul 20, 2006
Sold by
Blood Marcus
Bought by
Blood Marcus and Blood April
Home Financials for this Owner
Home Financials are based on the most recent Mortgage that was taken out on this home.
Original Mortgage
$180,900
Interest Rate
9.99%
Mortgage Type
Adjustable Rate Mortgage/ARM
Create a Home Valuation Report for This Property
The Home Valuation Report is an in-depth analysis detailing your home's value as well as a comparison with similar homes in the area
Home Values in the Area
Average Home Value in this Area
Purchase History
| Date | Buyer | Sale Price | Title Company |
|---|---|---|---|
| Vonmanowski Silke | -- | Meridian Title Company | |
| Vonmanowski Silke Von | -- | None Available | |
| Vonvonmanowski Gary Von | -- | First American Title Insuran | |
| Vonvonmanowski Gary Von | -- | Title Guarantee | |
| Manowski Gary | -- | First American Title Insuran | |
| Blood Marcus | -- | First American Title Insuran | |
| Blood Marcus | -- | None Available | |
| Blood Marcus | -- | Accommodation | |
| Blood Marcus M | -- | First American Title Ins Ag | |
| Blood Marcus | -- | Equity Title |
Source: Public Records
Mortgage History
| Date | Status | Borrower | Loan Amount |
|---|---|---|---|
| Previous Owner | Vonmanowski Silke | $120,000 | |
| Previous Owner | Manowski Gary | $211,111 | |
| Previous Owner | Blood Marcus | $197,790 | |
| Previous Owner | Blood Marcus M | $210,289 | |
| Previous Owner | Blood Marcus | $180,900 |
Source: Public Records
Tax History Compared to Growth
Tax History
| Year | Tax Paid | Tax Assessment Tax Assessment Total Assessment is a certain percentage of the fair market value that is determined by local assessors to be the total taxable value of land and additions on the property. | Land | Improvement |
|---|---|---|---|---|
| 2025 | $2,744 | $410,479 | $203,750 | $206,729 |
| 2024 | $3,025 | $230,926 | $112,063 | $118,863 |
| 2023 | $3,025 | $252,629 | $106,597 | $146,032 |
| 2022 | $2,729 | $234,786 | $109,478 | $125,308 |
| 2021 | $2,171 | $156,260 | $46,441 | $109,819 |
| 2020 | $2,092 | $261,138 | $84,438 | $176,700 |
| 2019 | $1,939 | $238,090 | $84,438 | $153,652 |
| 2018 | $1,792 | $208,610 | $75,000 | $133,610 |
| 2017 | $1,177 | $160,401 | $46,063 | $114,338 |
| 2016 | $1,015 | $81,413 | $25,335 | $56,078 |
| 2015 | $1,015 | $73,819 | $0 | $0 |
| 2014 | -- | $73,819 | $0 | $0 |
Source: Public Records
Map
Nearby Homes