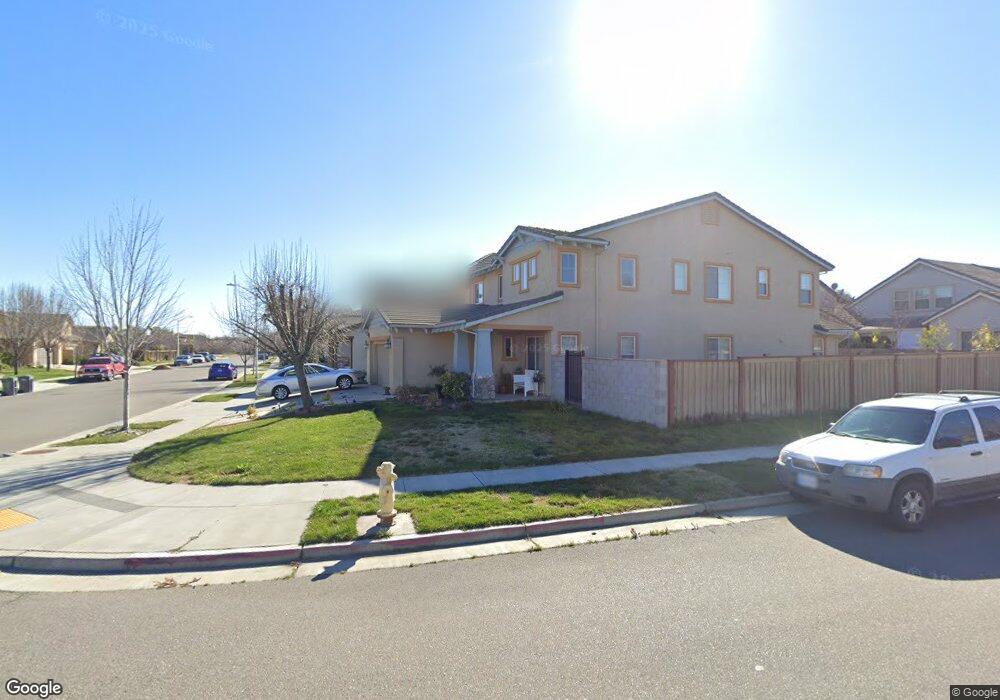
3800 Kaweah St West Sacramento, CA 95691
Southport NeighborhoodEstimated Value: $384,000 - $722,000
4
Beds
3
Baths
2,887
Sq Ft
$218/Sq Ft
Est. Value
About This Home
This home is located at 3800 Kaweah St, West Sacramento, CA 95691 and is currently estimated at $630,301, approximately $218 per square foot. 3800 Kaweah St is a home located in Yolo County with nearby schools including Bridgeway Island Elementary School, River City High, and Empowering Possibilities International Charter School.
Ownership History
Date
Name
Owned For
Owner Type
Purchase Details
Closed on
Apr 18, 2008
Sold by
Downey Sla Fa
Bought by
Mundhenk Christopher D and Mundhenk Kimberly M
Current Estimated Value
Home Financials for this Owner
Home Financials are based on the most recent Mortgage that was taken out on this home.
Original Mortgage
$313,200
Outstanding Balance
$196,633
Interest Rate
5.8%
Mortgage Type
Purchase Money Mortgage
Estimated Equity
$433,668
Purchase Details
Closed on
Dec 4, 2007
Sold by
Andreyev Vitaliy
Bought by
Downey Sla Fa
Purchase Details
Closed on
Nov 11, 2005
Sold by
Meritage Homes Of California Inc
Bought by
Andreyev Vitaliy
Home Financials for this Owner
Home Financials are based on the most recent Mortgage that was taken out on this home.
Original Mortgage
$98,286
Interest Rate
5.86%
Mortgage Type
Stand Alone Second
Create a Home Valuation Report for This Property
The Home Valuation Report is an in-depth analysis detailing your home's value as well as a comparison with similar homes in the area
Home Values in the Area
Average Home Value in this Area
Purchase History
| Date | Buyer | Sale Price | Title Company |
|---|---|---|---|
| Mundhenk Christopher D | $348,000 | Commonwealth Land Title Co | |
| Downey Sla Fa | $450,921 | None Available | |
| Andreyev Vitaliy | $491,500 | First American Title |
Source: Public Records
Mortgage History
| Date | Status | Borrower | Loan Amount |
|---|---|---|---|
| Open | Mundhenk Christopher D | $313,200 | |
| Previous Owner | Andreyev Vitaliy | $98,286 | |
| Previous Owner | Andreyev Vitaliy | $393,144 |
Source: Public Records
Tax History Compared to Growth
Tax History
| Year | Tax Paid | Tax Assessment Tax Assessment Total Assessment is a certain percentage of the fair market value that is determined by local assessors to be the total taxable value of land and additions on the property. | Land | Improvement |
|---|---|---|---|---|
| 2025 | $7,607 | $457,088 | $164,182 | $292,906 |
| 2023 | $7,607 | $439,340 | $157,807 | $281,533 |
| 2022 | $7,180 | $430,726 | $154,713 | $276,013 |
| 2021 | $7,117 | $422,281 | $151,680 | $270,601 |
| 2020 | $11,577 | $417,952 | $150,125 | $267,827 |
| 2019 | $11,502 | $409,758 | $147,182 | $262,576 |
| 2018 | $11,373 | $401,725 | $144,297 | $257,428 |
| 2017 | $11,317 | $393,849 | $141,468 | $252,381 |
| 2016 | $11,225 | $386,128 | $138,695 | $247,433 |
| 2015 | $6,119 | $380,329 | $136,612 | $243,717 |
| 2014 | $6,119 | $372,879 | $133,936 | $238,943 |
Source: Public Records
Map
Nearby Homes
- 3290 Pillsbury Rd
- 4009 Martis St
- 4029 Dover St
- 4025 Shaver Ct
- 3549 Tebti Rd
- 3236 Boston Rd
- 4057 Southampton St
- 4074 Southampton St
- 4035 Tebti Ct
- 3125 Gladys Ave
- 3825 Big Bear St
- 3255 Marshall Rd
- 3450 Seymour Ave
- 3580 Saint Lucia Place
- 3817 Rock Creek Rd
- 3750 Bridgeway Lakes Dr
- 3576 Hume St
- The 3981 Plan at River's Edge
- The 4007 Plan at River's Edge
- The 3998 Plan at River's Edge