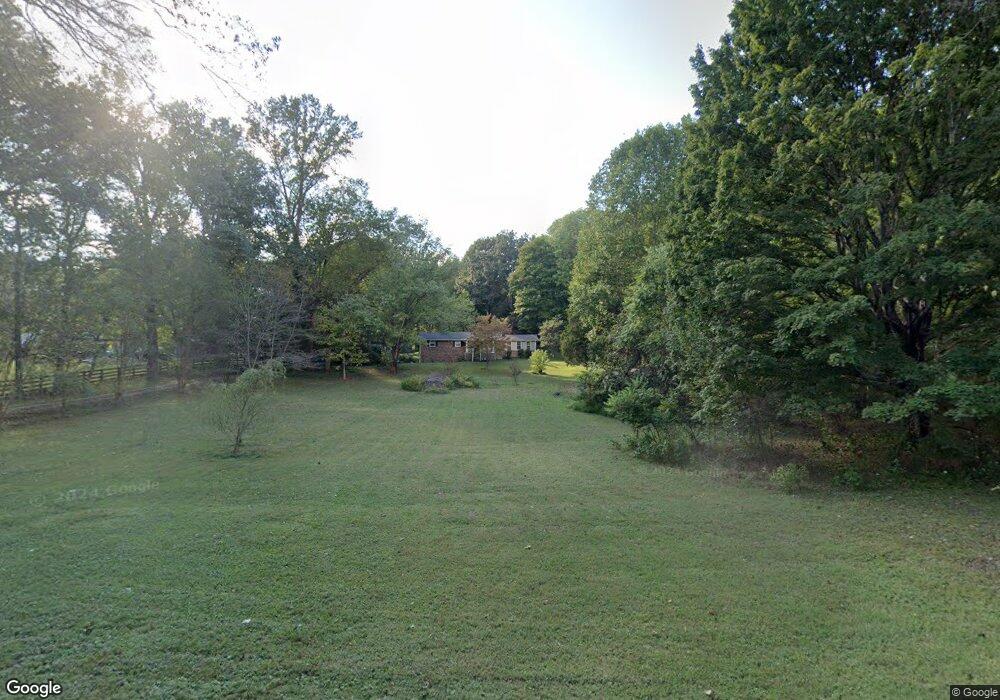
3802 Clarity Rd Springfield, TN 37172
Estimated Value: $371,807 - $450,000
Studio
2
Baths
1,520
Sq Ft
$268/Sq Ft
Est. Value
About This Home
This home is located at 3802 Clarity Rd, Springfield, TN 37172 and is currently estimated at $407,452, approximately $268 per square foot. 3802 Clarity Rd is a home located in Robertson County with nearby schools including Crestview Elementary School, Innovation Academy, and Springfield High School.
Ownership History
Date
Name
Owned For
Owner Type
Purchase Details
Closed on
Mar 27, 2000
Sold by
West Robert O
Bought by
Cannady Ellis T and Cannady Margaret
Current Estimated Value
Purchase Details
Closed on
Mar 16, 2000
Sold by
Fann Ross
Bought by
Corbin Brian N and Corbin Holly V
Purchase Details
Closed on
Jan 7, 2000
Bought by
Robertson Carl E and Robertson Vickie
Purchase Details
Closed on
Dec 30, 1999
Sold by
Landrum Joe O and Landrum Judy C
Bought by
Fanlan Investments Llc
Purchase Details
Closed on
Jun 17, 1999
Sold by
Fann Ross and Fann Jacquelyn
Bought by
Landrum Joe O and Landrum Judy C
Home Financials for this Owner
Home Financials are based on the most recent Mortgage that was taken out on this home.
Original Mortgage
$125,000
Interest Rate
7.04%
Purchase Details
Closed on
Dec 21, 1998
Sold by
Reaves Michael E
Bought by
Fann Ross and Fann Jacquelyn
Purchase Details
Closed on
Nov 23, 1970
Bought by
West Robert O
Create a Home Valuation Report for This Property
The Home Valuation Report is an in-depth analysis detailing your home's value as well as a comparison with similar homes in the area
Home Values in the Area
Average Home Value in this Area
Purchase History
| Date | Buyer | Sale Price | Title Company |
|---|---|---|---|
| Cannady Ellis T | $28,000 | -- | |
| Corbin Brian N | $26,000 | -- | |
| Robertson Carl E | $23,000 | -- | |
| Fanlan Investments Llc | -- | -- | |
| Landrum Joe O | $125,500 | -- | |
| Fann Ross | $137,500 | -- | |
| West Robert O | -- | -- |
Source: Public Records
Mortgage History
| Date | Status | Borrower | Loan Amount |
|---|---|---|---|
| Previous Owner | West Robert O | $125,000 |
Source: Public Records
Tax History
| Year | Tax Paid | Tax Assessment Tax Assessment Total Assessment is a certain percentage of the fair market value that is determined by local assessors to be the total taxable value of land and additions on the property. | Land | Improvement |
|---|---|---|---|---|
| 2025 | $1,699 | $94,375 | $41,100 | $53,275 |
| 2024 | $1,699 | $94,375 | $41,100 | $53,275 |
| 2023 | $1,699 | $94,375 | $41,100 | $53,275 |
| 2022 | $1,191 | $46,250 | $16,950 | $29,300 |
| 2021 | $1,191 | $46,250 | $16,950 | $29,300 |
| 2020 | $1,191 | $46,250 | $16,950 | $29,300 |
| 2019 | $1,191 | $46,250 | $16,950 | $29,300 |
| 2018 | $1,191 | $46,250 | $16,950 | $29,300 |
| 2017 | $1,242 | $40,275 | $14,950 | $25,325 |
| 2016 | $1,242 | $40,275 | $14,950 | $25,325 |
| 2015 | $1,192 | $40,275 | $14,950 | $25,325 |
| 2014 | $1,192 | $40,275 | $14,950 | $25,325 |
Source: Public Records
Map
Nearby Homes
- 5572 Highway 76 E
- 5827 Highway 76 E
- 965 Hunters Ln
- 966 Hunters Ln
- 962 Hunters Ln
- 958 Hunters Ln
- 954 Hunters Ln
- 803 Red Hollow Dr
- 950 Hunters Ln
- 946 Hunters Ln
- 942 Hunters Ln
- 938 Hunters Ln
- 1073 Rector Ln
- 793 Spring Cir
- 349 Fieldstone Ln
- 340 Fieldstone Ln
- 344 Brandywine Ln
- 514 Lakeside Dr
- 3608 Legacy Dr
- 312 Brandywine Ln
- 3782 Clarity Rd
- 3812 Clarity Rd
- 3779 Clarity Rd
- 3803 Clarity Rd
- 3811 Clarity Rd
- 3822 Clarity Rd
- 0 Clarity Rd Unit 3 2305038
- 0 Clarity Rd
- 3823 Clarity Rd
- 3761 Clarity Rd
- 3763 Clarity Rd
- 3747 Clarity Rd
- 3855 Clarity Rd
- 3767 Clarity Rd
- 5638 Highway 76 E
- 5630 Highway 76 E
- 3879 Clarity Rd
- 3906 Clarity Rd
- 5610 Highway 76 E
- 1 Highway 76 E
Your Personal Tour Guide
Ask me questions while you tour the home.