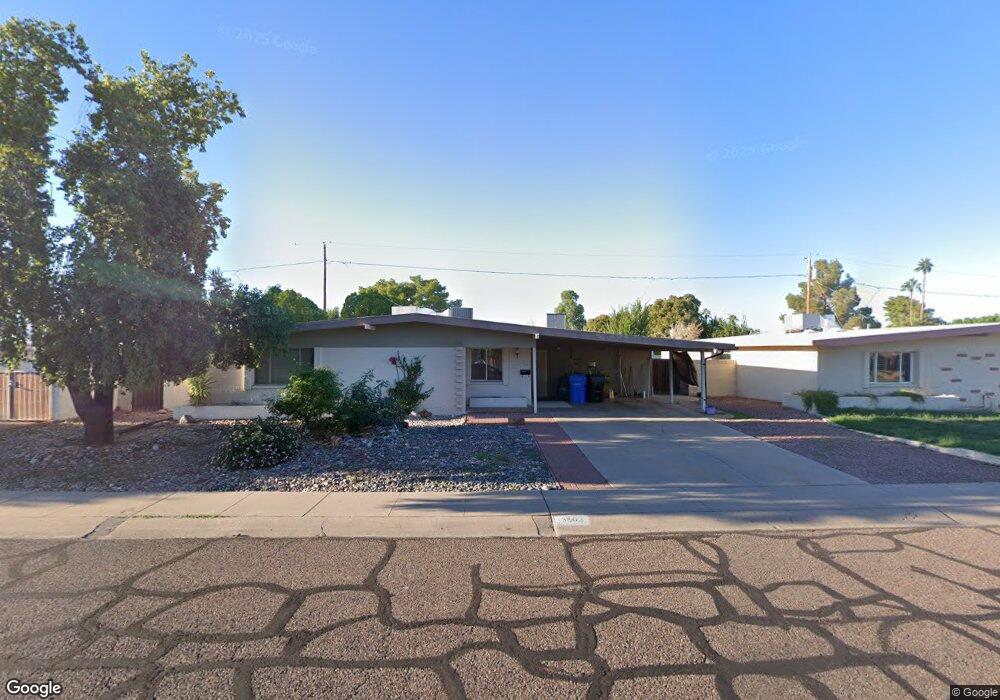
3802 E Poinsettia Dr Phoenix, AZ 85028
Paradise Valley Village NeighborhoodEstimated Value: $351,940 - $550,000
3
Beds
2
Baths
2,092
Sq Ft
$234/Sq Ft
Est. Value
About This Home
This home is located at 3802 E Poinsettia Dr, Phoenix, AZ 85028 and is currently estimated at $490,235, approximately $234 per square foot. 3802 E Poinsettia Dr is a home located in Maricopa County with nearby schools including Mercury Mine Elementary School, Shea Middle School, and Shadow Mountain High School.
Ownership History
Date
Name
Owned For
Owner Type
Purchase Details
Closed on
Nov 16, 2015
Sold by
Ballas Nancy and Ballas Nancy E
Bought by
Ballas Nancy
Current Estimated Value
Home Financials for this Owner
Home Financials are based on the most recent Mortgage that was taken out on this home.
Original Mortgage
$382,500
Outstanding Balance
$291,890
Interest Rate
2.94%
Mortgage Type
Reverse Mortgage Home Equity Conversion Mortgage
Estimated Equity
$198,345
Purchase Details
Closed on
Feb 12, 2010
Sold by
U S Bank Na
Bought by
Ballas Nancy E
Home Financials for this Owner
Home Financials are based on the most recent Mortgage that was taken out on this home.
Original Mortgage
$67,000
Interest Rate
5.02%
Mortgage Type
Purchase Money Mortgage
Purchase Details
Closed on
Aug 21, 2009
Sold by
Estate Of Judith I Knauff
Bought by
U S Bank Na and William O Knauff & Judith I Knauff Trust
Purchase Details
Closed on
May 31, 2002
Sold by
Keefe Robert B and Keefe Robert Benjamin
Bought by
Knauff Judith I
Home Financials for this Owner
Home Financials are based on the most recent Mortgage that was taken out on this home.
Original Mortgage
$130,150
Interest Rate
6.74%
Mortgage Type
New Conventional
Create a Home Valuation Report for This Property
The Home Valuation Report is an in-depth analysis detailing your home's value as well as a comparison with similar homes in the area
Home Values in the Area
Average Home Value in this Area
Purchase History
| Date | Buyer | Sale Price | Title Company |
|---|---|---|---|
| Ballas Nancy | -- | None Available | |
| Ballas Nancy E | $178,000 | Lawyers Title Insurance Corp | |
| U S Bank Na | -- | None Available | |
| Knauff Judith I | $137,000 | Old Republic Title Agency |
Source: Public Records
Mortgage History
| Date | Status | Borrower | Loan Amount |
|---|---|---|---|
| Open | Ballas Nancy | $382,500 | |
| Closed | Ballas Nancy E | $67,000 | |
| Previous Owner | Knauff Judith I | $130,150 |
Source: Public Records
Tax History Compared to Growth
Tax History
| Year | Tax Paid | Tax Assessment Tax Assessment Total Assessment is a certain percentage of the fair market value that is determined by local assessors to be the total taxable value of land and additions on the property. | Land | Improvement |
|---|---|---|---|---|
| 2025 | $1,556 | $17,975 | -- | -- |
| 2024 | $1,634 | $17,975 | -- | -- |
| 2023 | $1,634 | $30,200 | $6,040 | $24,160 |
| 2022 | $1,700 | $30,200 | $6,040 | $24,160 |
| 2021 | $1,728 | $27,220 | $5,440 | $21,780 |
| 2020 | $1,668 | $26,870 | $5,370 | $21,500 |
| 2019 | $1,676 | $25,170 | $5,030 | $20,140 |
| 2018 | $1,615 | $22,320 | $4,460 | $17,860 |
| 2017 | $1,542 | $22,320 | $4,460 | $17,860 |
| 2016 | $1,518 | $20,070 | $4,010 | $16,060 |
| 2015 | $1,408 | $18,930 | $3,780 | $15,150 |
Source: Public Records
Map
Nearby Homes
- 3834 E Shaw Butte Dr Unit 2
- 3732 E Altadena Ave
- 3926 E Laurel Ln
- 11621 N 39th St
- 3932 E Shaw Butte Dr
- 3924 E Cortez St
- 3733 E Charter Oak Rd
- 11840 N 40th Way
- 12048 N 40th Way
- 3470 E Paradise Dr
- 11625 N 40th Way
- 11615 N 40th Way
- 11837 N 40th Place
- 11845 N 40th Place
- 3941 E Cholla St
- 4011 E Charter Oak Rd
- 3430 E Poinsettia Dr
- 3422 E Sunnyside Dr
- 4043 E Paradise Dr
- 3401 E Shaw Butte Dr
- 3750 E Poinsettia Dr
- 3808 E Poinsettia Dr
- 3801 E Laurel Ln
- 3743 E Laurel Ln
- 3744 E Poinsettia Dr
- 3814 E Poinsettia Dr Unit 1
- 3807 E Laurel Ln
- 3801 E Poinsettia Dr
- 3807 E Poinsettia Dr
- 3815 E Poinsettia Dr
- 3737 E Laurel Ln
- 3738 E Poinsettia Dr
- 3822 E Poinsettia Dr
- 3759 E Poinsettia Dr
- 3813 E Laurel Ln
- 3746 E Laurel Ln
- 3802 E Laurel Ln
- 11801 N 38th St
- 3738 E Laurel Ln
- 3755 E Poinsettia Dr Unit 3