3802 Mohr Ave Pleasanton, CA 94588
Asco - Radum NeighborhoodEstimated Value: $1,903,000 - $2,224,000
About This Home
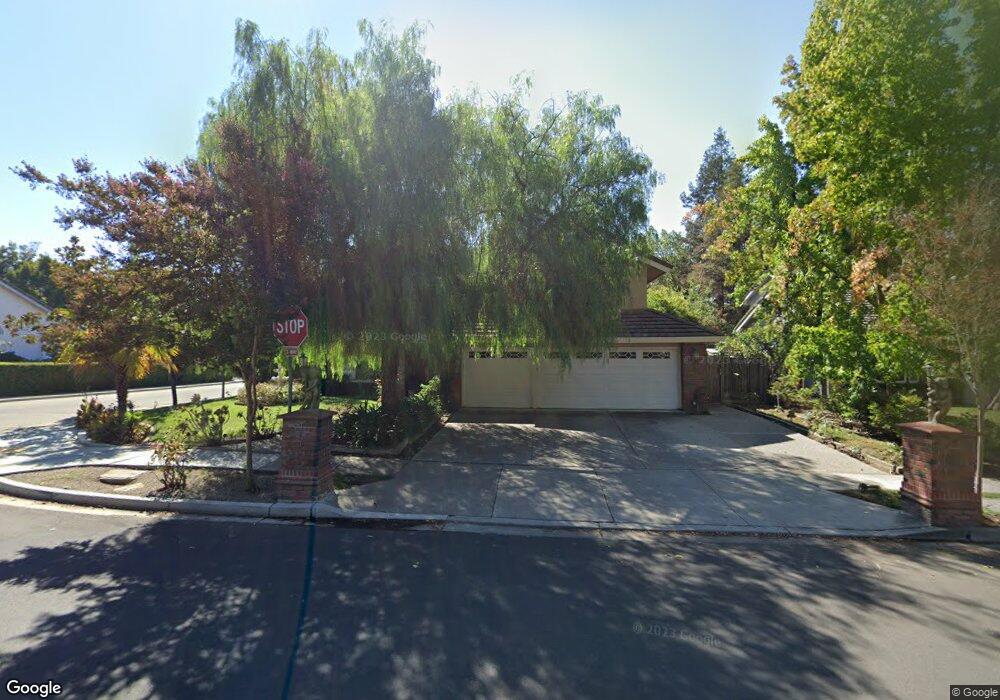
This home is located at 3802 Mohr Ave, Pleasanton, CA 94588 and is currently estimated at $2,085,966, approximately $748 per square foot. 3802 Mohr Ave is a home located in Alameda County with nearby schools including Henry P. Mohr Elementary School, Harvest Park Middle School, and Amador Valley High School.
Ownership History
We collect this data history from publicly available records. To have your information removed, we recommend requesting removal directly through your county’s website.
Purchase Details
Purchase Details
Home Financials for this Owner
Home Financials are based on the most recent Mortgage that was taken out on this home.Home Values in the Area
Average Home Value in this Area
Purchase History
We collect this data history from publicly available records. To have your information removed, we recommend requesting removal directly through your county’s website.
| Date | Buyer | Sale Price | Title Company |
|---|---|---|---|
| -- | Phillips Law Offices | ||
| $810,000 | Fidelity National Title Co |
Mortgage History
We collect this data history from publicly available records. To have your information removed, we recommend requesting removal directly through your county’s website.
| Date | Status | Borrower | Loan Amount |
|---|---|---|---|
| Previous Owner | $648,000 | ||
| Closed | $81,000 |
Tax History
We collect this data history from publicly available records. To have your information removed, we recommend requesting removal directly through your county’s website.
| Year | Tax Paid | Tax Assessment Tax Assessment Total Assessment is a certain percentage of the fair market value that is determined by local assessors to be the total taxable value of land and additions on the property. | Land | Improvement |
|---|---|---|---|---|
| 2025 | $13,214 | $1,144,584 | $345,475 | $806,109 |
| 2024 | $13,214 | $1,122,010 | $338,703 | $790,307 |
| 2023 | $13,061 | $1,106,872 | $332,061 | $774,811 |
| 2022 | $12,372 | $1,078,172 | $325,551 | $759,621 |
| 2021 | $12,054 | $1,056,901 | $319,170 | $744,731 |
| 2020 | $11,900 | $1,053,000 | $315,900 | $737,100 |
| 2019 | $12,044 | $1,032,352 | $309,705 | $722,647 |
| 2018 | $11,799 | $1,012,110 | $303,633 | $708,477 |
| 2017 | $11,496 | $992,265 | $297,679 | $694,586 |
| 2016 | $10,615 | $972,810 | $291,843 | $680,967 |
| 2015 | $10,415 | $958,197 | $287,459 | $670,738 |
| 2014 | $10,601 | $939,428 | $281,828 | $657,600 |
Map
- 1657 Holly Cir
- 3734 Mohr Ave
- 4042 Rennellwood Way
- 1558 Trimingham Dr
- 2205 Cameron Cir
- 3492 Dorset Ct
- 3206 Denton Ct
- 4433 Valley Ave
- 2090 Foxswallow Rd
- 3652 Huff Ct
- 4374 Valley Ave Unit D1
- 4362 Valley Ave Unit C5
- 2650 Laramie Gate Cir
- 4056 Nevis St
- 3136 Cranwood Ct
- 2749 Laramie Gate Cir
- 4844 Merganser Ct
- 3140 Thistledown Ct
- 1719 Baywood Ct
- 4458 Yuma Ct
- 3816 Mohr Ave
- 1782 Nursery Way
- 3796 Mohr Ave
- 1766 Nursery Way
- 3830 Mohr Ave
- 1855 Begonia Ct
- 1597 Maple Leaf Dr
- 1839 Begonia Ct
- 1750 Nursery Way
- 3788 Mohr Ave
- 3813 Mohr Ave
- 3844 Mohr Ave
- 1589 Maple Leaf Dr
- 1852 Begonia Ct
- 1855 Palmer Dr
- 1823 Begonia Ct
- 1734 Nursery Way
- 1581 Maple Leaf Dr
- 3780 Mohr Ave
- 3858 Mohr Ave
Ask me questions while you tour the home.