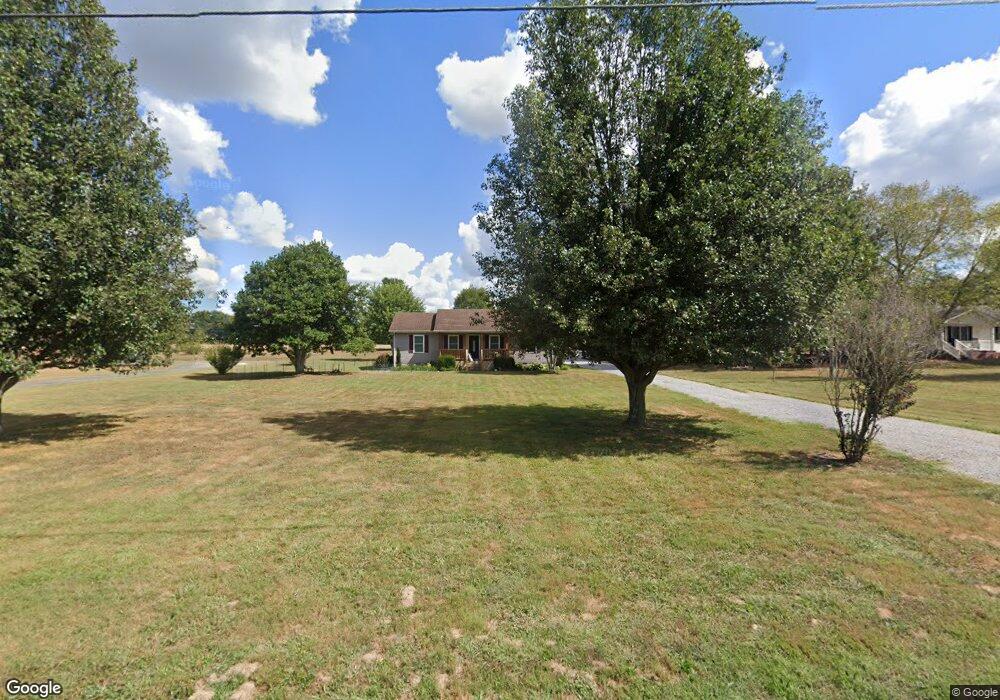
3803 Armstrong Rd Springfield, TN 37172
Estimated Value: $277,000 - $358,000
--
Bed
2
Baths
1,288
Sq Ft
$249/Sq Ft
Est. Value
About This Home
This home is located at 3803 Armstrong Rd, Springfield, TN 37172 and is currently estimated at $320,430, approximately $248 per square foot. 3803 Armstrong Rd is a home located in Robertson County with nearby schools including East Robertson Elementary School and East Robertson High School.
Ownership History
Date
Name
Owned For
Owner Type
Purchase Details
Closed on
Sep 19, 2016
Sold by
The Secretary Hud Development
Bought by
Shannon David and Shannon Stella
Current Estimated Value
Home Financials for this Owner
Home Financials are based on the most recent Mortgage that was taken out on this home.
Original Mortgage
$127,314
Outstanding Balance
$101,694
Interest Rate
3.43%
Mortgage Type
FHA
Estimated Equity
$218,736
Purchase Details
Closed on
May 17, 2016
Sold by
Regions Bank
Bought by
Secretary Of Housing And Urban Dev Washi and C/O Information Systems Networks Corp
Purchase Details
Closed on
Jun 3, 2015
Sold by
Harrison Timothy L
Bought by
Regions Bank
Purchase Details
Closed on
Aug 23, 2010
Sold by
Harrison Nancy L
Bought by
Harrison Timothy L
Purchase Details
Closed on
Aug 5, 2004
Sold by
Ameri Calsonickansei North
Bought by
Kocka John E and Kocka Lori S
Home Financials for this Owner
Home Financials are based on the most recent Mortgage that was taken out on this home.
Original Mortgage
$150,005
Interest Rate
6.19%
Create a Home Valuation Report for This Property
The Home Valuation Report is an in-depth analysis detailing your home's value as well as a comparison with similar homes in the area
Home Values in the Area
Average Home Value in this Area
Purchase History
| Date | Buyer | Sale Price | Title Company |
|---|---|---|---|
| Shannon David | $120,000 | Warranty Title Ins Co Inc | |
| Secretary Of Housing And Urban Dev Washi | $99,000 | -- | |
| Regions Bank | $99,000 | -- | |
| Harrison Timothy L | -- | -- | |
| Kocka John E | $157,900 | -- |
Source: Public Records
Mortgage History
| Date | Status | Borrower | Loan Amount |
|---|---|---|---|
| Open | Shannon David | $127,314 | |
| Previous Owner | Kocka John E | $150,005 |
Source: Public Records
Tax History Compared to Growth
Tax History
| Year | Tax Paid | Tax Assessment Tax Assessment Total Assessment is a certain percentage of the fair market value that is determined by local assessors to be the total taxable value of land and additions on the property. | Land | Improvement |
|---|---|---|---|---|
| 2024 | $964 | $53,575 | $12,500 | $41,075 |
| 2023 | $964 | $53,575 | $12,500 | $41,075 |
| 2022 | $986 | $38,275 | $6,200 | $32,075 |
| 2021 | $957 | $37,150 | $6,200 | $30,950 |
| 2020 | $957 | $37,150 | $6,200 | $30,950 |
| 2019 | $957 | $37,150 | $6,200 | $30,950 |
| 2018 | $957 | $37,150 | $6,200 | $30,950 |
| 2017 | $777 | $25,175 | $4,300 | $20,875 |
| 2016 | $777 | $25,175 | $4,300 | $20,875 |
| 2015 | $745 | $25,175 | $4,300 | $20,875 |
| 2014 | $745 | $25,175 | $4,300 | $20,875 |
Source: Public Records
Map
Nearby Homes
- 1074 Pair Six Dr
- 3972 Baggett Rd
- 4002 Baggett Rd
- 4031 Wells Rd
- 6012 Bethlehem Rd
- 12354 Owens Chapel Rd
- 3966 Baggett Rd
- 6015 Highway 76 E
- 6838 Highway 76 E
- 6948 Whispering Oaks Dr
- 6615 Herbert Shannon Rd
- 7855 Bethlehem Rd
- 5827 Highway 76 E
- 0 Homer Worsham Rd
- 4844 Homer Worsham Rd
- 3225 Pinson School Rd
- 344 Brandywine Ln
- 6210 Green Rd
- 1073 Rector Ln
- 2195 Savage Creek Dr
- 3765 Armstrong Rd
- 3799 Armstrong Rd
- 3779 Armstrong Rd
- 3811 Armstrong Rd
- 3795 Armstrong Rd
- 3764 Armstrong Rd
- 3743 Armstrong Rd
- 3746 Armstrong Rd
- 4923 Armstrong Rd
- 0 Armstrong Rd
- 3739 Armstrong Rd
- 3783 Armstrong Rd
- 3871 Armstrong Rd
- 3771 Armstrong Rd
- 3733 Armstrong Rd
- 3807 Armstrong Rd
- 3763 Armstrong Rd
- 3721 Armstrong Rd
- 3774 Armstrong Rd
- 3736 Armstrong Rd