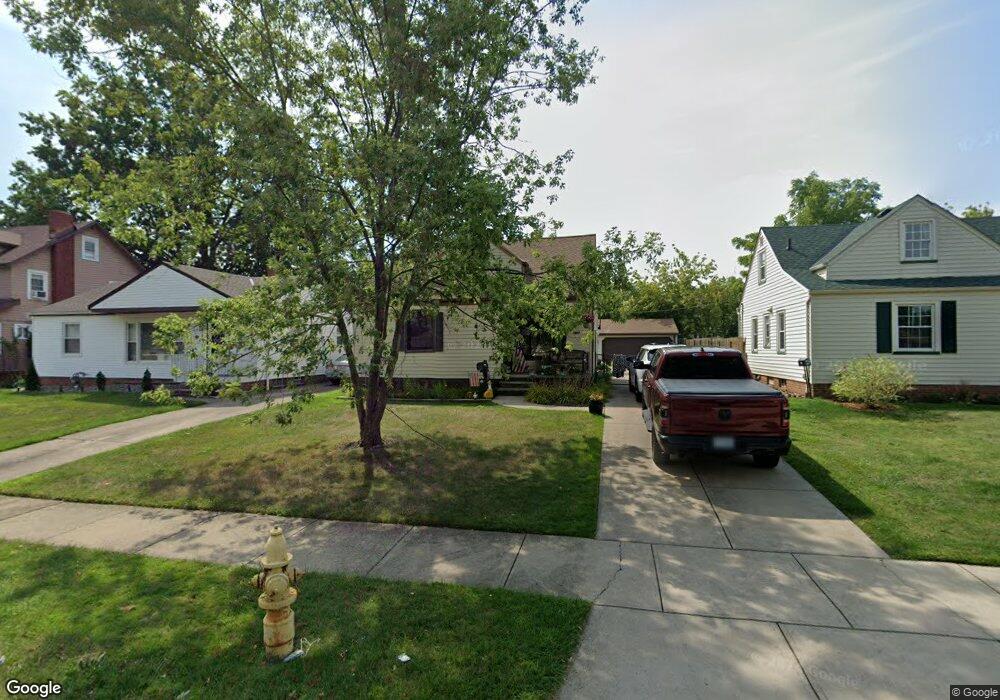
3803 Park Dr Cleveland, OH 44134
Estimated Value: $185,000 - $236,000
3
Beds
2
Baths
1,150
Sq Ft
$187/Sq Ft
Est. Value
About This Home
This home is located at 3803 Park Dr, Cleveland, OH 44134 and is currently estimated at $214,793, approximately $186 per square foot. 3803 Park Dr is a home located in Cuyahoga County with nearby schools including Dentzler Elementary School, Normandy High School, and Hillside Middle School.
Ownership History
Date
Name
Owned For
Owner Type
Purchase Details
Closed on
Oct 12, 2010
Sold by
Miller Alicia I
Bought by
Crowe Matthew B
Current Estimated Value
Purchase Details
Closed on
Sep 17, 2008
Sold by
Vargus Bonnie M
Bought by
Crowe Matthew B and Miller Alicia I
Home Financials for this Owner
Home Financials are based on the most recent Mortgage that was taken out on this home.
Original Mortgage
$91,200
Interest Rate
6.55%
Mortgage Type
Purchase Money Mortgage
Purchase Details
Closed on
Sep 24, 1992
Sold by
Goe William B
Bought by
Vargus Bonnie M
Purchase Details
Closed on
Jul 1, 1987
Sold by
Goe William B
Bought by
Goe William B
Purchase Details
Closed on
Sep 19, 1978
Sold by
Goe William B
Bought by
William B Goe
Purchase Details
Closed on
Feb 14, 1978
Sold by
Ropas Lois-Jean
Bought by
Goe William B
Purchase Details
Closed on
Apr 12, 1977
Sold by
Ropas Thomas J and Ropas Lois J
Bought by
Ropas Lois-Jean
Purchase Details
Closed on
Jan 1, 1975
Bought by
Ropas Thomas J and Ropas Lois J
Create a Home Valuation Report for This Property
The Home Valuation Report is an in-depth analysis detailing your home's value as well as a comparison with similar homes in the area
Home Values in the Area
Average Home Value in this Area
Purchase History
| Date | Buyer | Sale Price | Title Company |
|---|---|---|---|
| Crowe Matthew B | -- | Public | |
| Crowe Matthew B | $114,000 | Attorney | |
| Vargus Bonnie M | $74,500 | -- | |
| Goe William B | -- | -- | |
| William B Goe | -- | -- | |
| Goe William B | $43,000 | -- | |
| Ropas Lois-Jean | -- | -- | |
| Ropas Thomas J | -- | -- |
Source: Public Records
Mortgage History
| Date | Status | Borrower | Loan Amount |
|---|---|---|---|
| Previous Owner | Crowe Matthew B | $91,200 |
Source: Public Records
Tax History Compared to Growth
Tax History
| Year | Tax Paid | Tax Assessment Tax Assessment Total Assessment is a certain percentage of the fair market value that is determined by local assessors to be the total taxable value of land and additions on the property. | Land | Improvement |
|---|---|---|---|---|
| 2024 | $3,848 | $63,280 | $12,110 | $51,170 |
| 2023 | $3,388 | $47,820 | $9,840 | $37,980 |
| 2022 | $3,358 | $47,810 | $9,835 | $37,975 |
| 2021 | $3,455 | $47,810 | $9,840 | $37,980 |
| 2020 | $3,275 | $40,180 | $8,260 | $31,920 |
| 2019 | $3,142 | $114,800 | $23,600 | $91,200 |
| 2018 | $3,162 | $40,180 | $8,260 | $31,920 |
| 2017 | $3,063 | $36,340 | $6,900 | $29,440 |
| 2016 | $3,044 | $36,340 | $6,900 | $29,440 |
| 2015 | $2,971 | $36,340 | $6,900 | $29,440 |
| 2014 | $2,971 | $37,460 | $7,110 | $30,350 |
Source: Public Records
Map
Nearby Homes
- 3430 Park Dr
- 3807 Klusner Ave
- 3711 Klusner Ave
- 3414 Klusner Ave
- 7030 Lyle Ave
- 3018 Center Dr
- 3262 Marda Dr
- 0 Orchard Park Dr
- 3610 Jeanne Dr
- 3011 Klusner Ave
- 3195 Marda Dr
- 4601 W Ridgewood Dr
- 4001 W Ridgewood Dr
- 2838 Marda Dr
- 5208 Orchard Park Dr
- 6480 State Rd Unit F10
- 3200 Dentzler Rd
- 5211 W Ridgewood Dr
- 6474 State Rd Unit I-10
- 2410 Park Dr