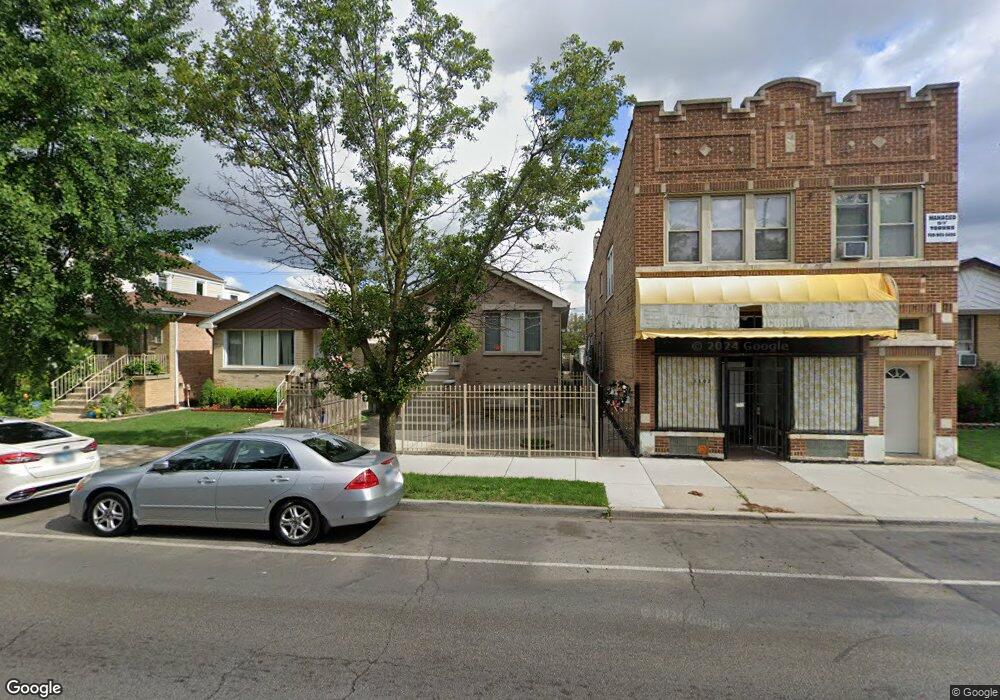
3804 W 59th St Chicago, IL 60629
West Elsdon NeighborhoodEstimated Value: $318,662 - $345,000
3
Beds
2
Baths
1,262
Sq Ft
$263/Sq Ft
Est. Value
About This Home
This home is located at 3804 W 59th St, Chicago, IL 60629 and is currently estimated at $331,416, approximately $262 per square foot. 3804 W 59th St is a home located in Cook County with nearby schools including Peck Elementary School, Richardson Middle School, and Curie Metropolitan High School.
Ownership History
Date
Name
Owned For
Owner Type
Purchase Details
Closed on
Nov 21, 2005
Sold by
Greene Kevin G and Greene Noel
Bought by
Navarro Pablo and Navarro Veronica
Current Estimated Value
Home Financials for this Owner
Home Financials are based on the most recent Mortgage that was taken out on this home.
Original Mortgage
$279,000
Outstanding Balance
$154,360
Interest Rate
6.2%
Mortgage Type
Fannie Mae Freddie Mac
Estimated Equity
$177,056
Purchase Details
Closed on
Oct 4, 2004
Sold by
Marquette Bank
Bought by
Oak Leaf Construction
Home Financials for this Owner
Home Financials are based on the most recent Mortgage that was taken out on this home.
Original Mortgage
$60,000
Interest Rate
5%
Mortgage Type
Purchase Money Mortgage
Purchase Details
Closed on
Dec 18, 2001
Sold by
Rodriguez Jesus and Rodriguez Jose L
Bought by
Rodriguez Jesus and Rodriguez Maria
Home Financials for this Owner
Home Financials are based on the most recent Mortgage that was taken out on this home.
Original Mortgage
$148,000
Interest Rate
6.53%
Create a Home Valuation Report for This Property
The Home Valuation Report is an in-depth analysis detailing your home's value as well as a comparison with similar homes in the area
Home Values in the Area
Average Home Value in this Area
Purchase History
| Date | Buyer | Sale Price | Title Company |
|---|---|---|---|
| Navarro Pablo | $310,000 | Chicago Title Insurance Comp | |
| Oak Leaf Construction | $75,000 | Atgf Inc | |
| Rodriguez Jesus | -- | -- |
Source: Public Records
Mortgage History
| Date | Status | Borrower | Loan Amount |
|---|---|---|---|
| Open | Navarro Pablo | $279,000 | |
| Previous Owner | Oak Leaf Construction | $60,000 | |
| Previous Owner | Rodriguez Jesus | $148,000 |
Source: Public Records
Tax History Compared to Growth
Tax History
| Year | Tax Paid | Tax Assessment Tax Assessment Total Assessment is a certain percentage of the fair market value that is determined by local assessors to be the total taxable value of land and additions on the property. | Land | Improvement |
|---|---|---|---|---|
| 2024 | $3,942 | $27,000 | $2,500 | $24,500 |
| 2023 | $3,821 | $22,000 | $3,125 | $18,875 |
| 2022 | $3,821 | $22,000 | $3,125 | $18,875 |
| 2021 | $3,754 | $22,000 | $3,125 | $18,875 |
| 2020 | $3,692 | $19,674 | $3,125 | $16,549 |
| 2019 | $3,752 | $22,106 | $3,125 | $18,981 |
| 2018 | $3,688 | $22,106 | $3,125 | $18,981 |
| 2017 | $3,346 | $18,920 | $2,812 | $16,108 |
| 2016 | $3,289 | $18,920 | $2,812 | $16,108 |
| 2015 | $2,986 | $18,920 | $2,812 | $16,108 |
| 2014 | $2,702 | $17,131 | $2,656 | $14,475 |
| 2013 | $2,637 | $17,131 | $2,656 | $14,475 |
Source: Public Records
Map
Nearby Homes
- 3745 W 59th Place
- 3912 W 59th St
- 3709 W 59th Place
- 3710 W 60th Place
- 3909 W 60th Place
- 4015 W 59th St
- 3641 W 57th St
- 3704 W 57th St
- 2711 W 59th St
- 3817 W 61st St
- 3535 W 58th St
- 3817 W 61st Place
- 3711 W 56th Place
- 3927 W 56th St
- 3502 W 58th Place
- 4036 W 57th St
- 3441 W 59th St
- 5740 S Trumbull Ave
- 5921 S Keeler Ave
- 5730 S Trumbull Ave
- 3808 W 59th St
- 3802 W 59th St
- 3810 W 59th St
- 3800 W 59th St
- 3812 W 59th St
- 3816 W 59th St
- 3807 W 58th Place
- 3758 W 59th St
- 3758 W 59th St
- 3803 W 58th Place
- 3811 W 58th Place
- 3801 W 58th Place
- 3820 W 59th St
- 3813 W 58th Place
- 3801 W 59th St
- 3824 W 59th St
- 3815 W 58th Place
- 3817 W 58th Place
- 3805 W 59th St
- 3809 W 59th St