M
Seller's Agent in 2026
Matthew Treakle
HomeSmart
(602) 954-6888
1 in this area
1 Total Sale
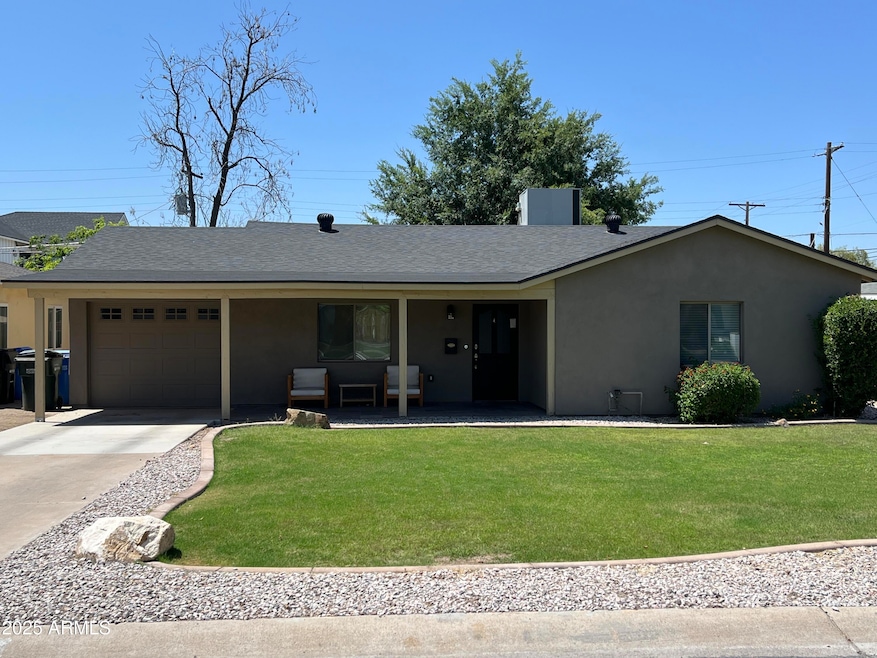
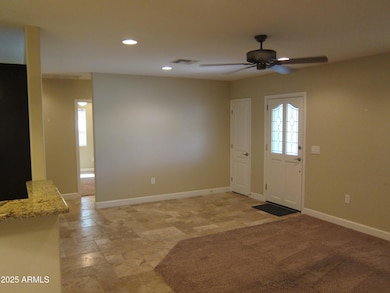
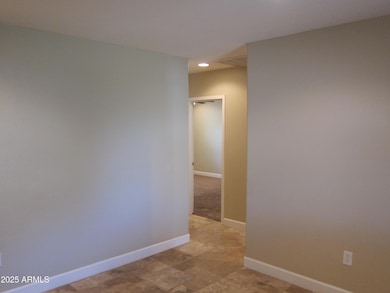
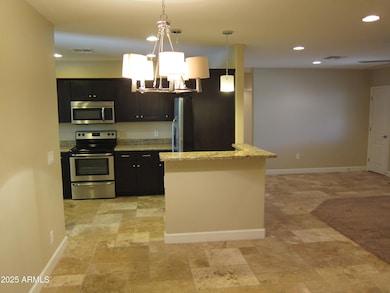
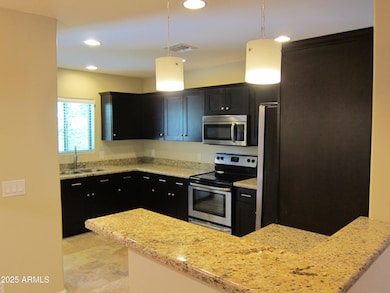
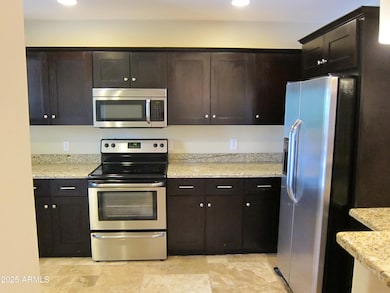
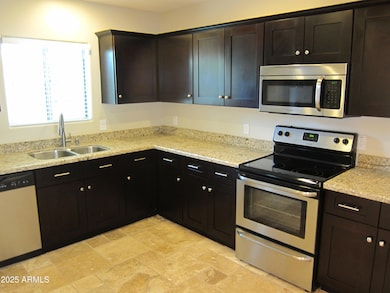
Updated Arcadia Lite home in a great location near The Vig, LGO, Postino's, Scottsdale Fashion Square and many more restaurants/entertainment. Situated in an established neighborhood with great mountain views and surrounded by many newly constructed homes. Features include a large kitchen with granite counters and dark, rich cabinets. All stainless steel appliances. Newer roof, flooring, lighting and fixtures. There are three full bedrooms and two full bathrooms along with a bonus room that could be used as an office or a game room. Generous size backyard which is great for entertaining. Roof replaced in 2022. Buyer to verify all facts and figures.
Last Agent to Sell the Property
HomeSmart License #SA652193000 Listed on: 07/22/2025

| Date | Type | Sale Price | Title Company |
|---|---|---|---|
| Warranty Deed | $715,000 | Equitable Title | |
| Cash Sale Deed | $265,000 | Great American Title Agency | |
| Trustee Deed | $157,000 | None Available |
| Date | Status | Loan Amount | Loan Type |
|---|---|---|---|
| Open | $500,500 | New Conventional |
| Date | Event | Price | List to Sale | Price per Sq Ft | Prior Sale |
|---|---|---|---|---|---|
| 02/06/2026 02/06/26 | Sold | $715,000 | -1.4% | $466 / Sq Ft | |
| 01/06/2026 01/06/26 | Pending | -- | -- | -- | |
| 01/02/2026 01/02/26 | Off Market | $725,000 | -- | -- | |
| 12/29/2025 12/29/25 | For Sale | $725,000 | 0.0% | $473 / Sq Ft | |
| 12/10/2025 12/10/25 | Price Changed | $725,000 | -3.2% | $473 / Sq Ft | |
| 12/10/2025 12/10/25 | For Sale | $749,000 | 0.0% | $488 / Sq Ft | |
| 12/06/2025 12/06/25 | Off Market | $749,000 | -- | -- | |
| 11/12/2025 11/12/25 | Price Changed | $749,000 | -2.1% | $488 / Sq Ft | |
| 10/25/2025 10/25/25 | Price Changed | $765,000 | -1.9% | $499 / Sq Ft | |
| 10/03/2025 10/03/25 | Off Market | $780,000 | -- | -- | |
| 09/15/2025 09/15/25 | For Sale | $780,000 | 0.0% | $508 / Sq Ft | |
| 09/06/2025 09/06/25 | Price Changed | $780,000 | -2.4% | $508 / Sq Ft | |
| 08/15/2025 08/15/25 | Price Changed | $799,000 | -3.2% | $521 / Sq Ft | |
| 07/22/2025 07/22/25 | For Sale | $825,000 | 0.0% | $538 / Sq Ft | |
| 07/22/2025 07/22/25 | Price Changed | $825,000 | 0.0% | $538 / Sq Ft | |
| 07/15/2024 07/15/24 | Rented | $3,000 | 0.0% | -- | |
| 06/28/2024 06/28/24 | Price Changed | $3,000 | -4.8% | $2 / Sq Ft | |
| 05/08/2024 05/08/24 | Price Changed | $3,150 | -4.5% | $2 / Sq Ft | |
| 04/21/2024 04/21/24 | For Rent | $3,300 | +11.9% | -- | |
| 03/01/2023 03/01/23 | Rented | $2,950 | 0.0% | -- | |
| 01/25/2023 01/25/23 | Under Contract | -- | -- | -- | |
| 11/30/2022 11/30/22 | For Rent | $2,950 | 0.0% | -- | |
| 02/15/2022 02/15/22 | Rented | $2,950 | 0.0% | -- | |
| 01/14/2022 01/14/22 | Price Changed | $2,950 | -4.8% | $2 / Sq Ft | |
| 11/29/2021 11/29/21 | For Rent | $3,100 | +21.6% | -- | |
| 01/04/2020 01/04/20 | Rented | $2,550 | 0.0% | -- | |
| 12/05/2019 12/05/19 | Price Changed | $2,550 | -1.9% | $2 / Sq Ft | |
| 11/23/2019 11/23/19 | Price Changed | $2,600 | -1.9% | $2 / Sq Ft | |
| 10/19/2019 10/19/19 | For Rent | $2,650 | +8.2% | -- | |
| 07/09/2018 07/09/18 | Rented | $2,450 | 0.0% | -- | |
| 06/04/2018 06/04/18 | For Rent | $2,450 | +6.5% | -- | |
| 01/10/2018 01/10/18 | Rented | $2,300 | 0.0% | -- | |
| 11/28/2017 11/28/17 | Price Changed | $2,300 | -4.2% | $1 / Sq Ft | |
| 11/09/2017 11/09/17 | For Rent | $2,400 | +20.0% | -- | |
| 02/09/2017 02/09/17 | Rented | $2,000 | -11.1% | -- | |
| 02/04/2017 02/04/17 | Price Changed | $2,250 | -4.3% | $1 / Sq Ft | |
| 01/29/2017 01/29/17 | Price Changed | $2,350 | -5.1% | $2 / Sq Ft | |
| 12/24/2016 12/24/16 | Price Changed | $2,475 | -6.6% | $2 / Sq Ft | |
| 12/02/2016 12/02/16 | For Rent | $2,650 | +23.3% | -- | |
| 06/25/2015 06/25/15 | Rented | $2,150 | +2.4% | -- | |
| 06/13/2015 06/13/15 | Under Contract | -- | -- | -- | |
| 05/21/2015 05/21/15 | For Rent | $2,100 | +27.3% | -- | |
| 12/28/2012 12/28/12 | Rented | $1,650 | -99.4% | -- | |
| 12/05/2012 12/05/12 | Under Contract | -- | -- | -- | |
| 10/08/2012 10/08/12 | Sold | $265,000 | 0.0% | $148 / Sq Ft | View Prior Sale |
| 10/03/2012 10/03/12 | For Rent | $1,995 | 0.0% | -- | |
| 10/01/2012 10/01/12 | Pending | -- | -- | -- | |
| 09/21/2012 09/21/12 | Price Changed | $278,900 | -2.4% | $155 / Sq Ft | |
| 09/04/2012 09/04/12 | For Sale | $285,900 | 0.0% | $159 / Sq Ft | |
| 09/04/2012 09/04/12 | Price Changed | $285,900 | +0.8% | $159 / Sq Ft | |
| 08/06/2012 08/06/12 | Pending | -- | -- | -- | |
| 08/02/2012 08/02/12 | For Sale | $283,500 | +7.0% | $158 / Sq Ft | |
| 07/23/2012 07/23/12 | Off Market | $265,000 | -- | -- | |
| 07/18/2012 07/18/12 | Price Changed | $283,500 | -4.7% | $158 / Sq Ft | |
| 07/07/2012 07/07/12 | For Sale | $297,500 | -- | $166 / Sq Ft |
| Year | Tax Paid | Tax Assessment Tax Assessment Total Assessment is a certain percentage of the fair market value that is determined by local assessors to be the total taxable value of land and additions on the property. | Land | Improvement |
|---|---|---|---|---|
| 2025 | $4,516 | $33,433 | -- | -- |
| 2024 | $4,296 | $31,841 | -- | -- |
| 2023 | $4,296 | $53,020 | $10,600 | $42,420 |
| 2022 | $4,128 | $40,750 | $8,150 | $32,600 |
| 2021 | $4,228 | $40,530 | $8,100 | $32,430 |
| 2020 | $4,125 | $37,110 | $7,420 | $29,690 |
| 2019 | $4,096 | $34,310 | $6,860 | $27,450 |
| 2018 | $4,012 | $32,960 | $6,590 | $26,370 |
| 2017 | $3,857 | $30,080 | $6,010 | $24,070 |
| 2016 | $3,708 | $27,670 | $5,530 | $22,140 |
| 2015 | $3,449 | $25,920 | $5,180 | $20,740 |
M
Seller's Agent in 2026
Matthew Treakle
HomeSmart
(602) 954-6888
1 in this area
1 Total Sale
Buyer's Agent in 2026
Anthony Kadi
American Realty Brokers
(480) 580-6098
4 in this area
39 Total Sales
N
Buyer's Agent in 2024
Non-MLS Agent
Non-MLS Office
Buyer's Agent in 2018
Mary Wolf-Breen
Russ Lyon Sotheby's International Realty
(488) 495-9948
132 Total Sales
W
Buyer's Agent in 2015
William Moore
Fieldstone West Realty, Inc
Seller's Agent in 2012
Barbara Smith
Russ Lyon Sotheby's International Realty
(602) 741-9031
1 in this area
42 Total Sales
Source: Arizona Regional Multiple Listing Service (ARMLS)
MLS Number: 6887562
APN: 170-32-078
Disclaimer: Certain information contained herein is derived from information provided by parties other than Homes.com. All information provided is deemed reliable, but is not guaranteed to be accurate and should be independently verified.
![]() All information should be verified by the recipient and none is guaranteed as accurate by ARMLS
All information should be verified by the recipient and none is guaranteed as accurate by ARMLS
Listing Information presented by local MLS brokerage: Ten-X, local REALTOR®- Arlene Richardson - (888)-952-6393
Ask me questions while you tour the home.