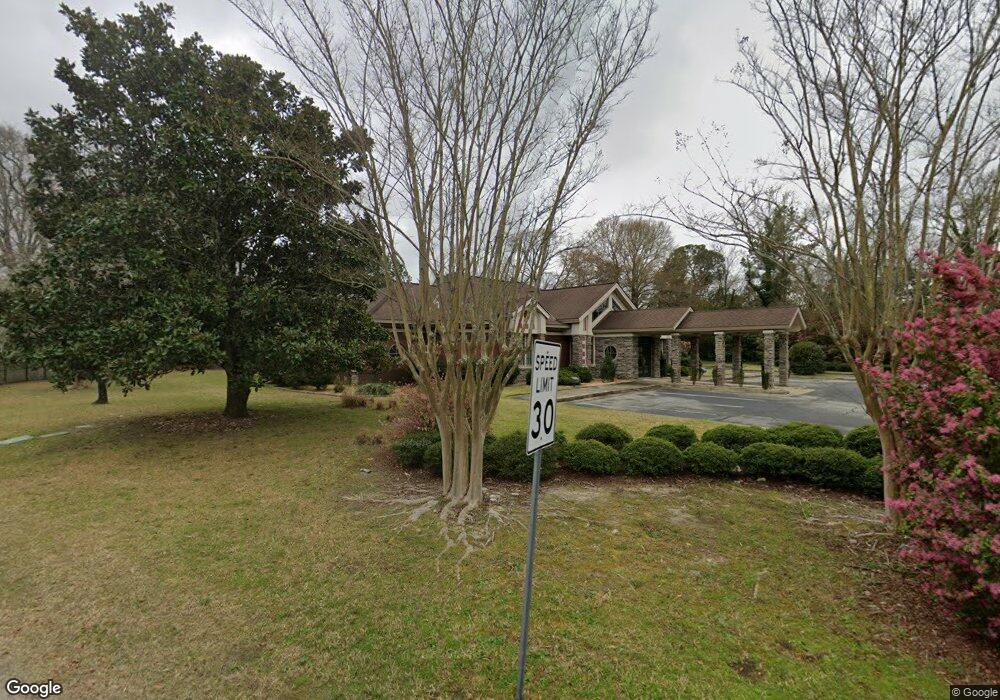
3808 Gentian Blvd Columbus, GA 31907
Eastern Columbus NeighborhoodEstimated Value: $852,386
3
Beds
2
Baths
5,735
Sq Ft
$149/Sq Ft
Est. Value
About This Home
This home is located at 3808 Gentian Blvd, Columbus, GA 31907 and is currently estimated at $852,386, approximately $148 per square foot. 3808 Gentian Blvd is a home located in Muscogee County with nearby schools including Gentian Elementary School, Fort Middle School, and Hardaway High School.
Ownership History
Date
Name
Owned For
Owner Type
Purchase Details
Closed on
Aug 12, 2020
Sold by
St Francis Propco Llc
Bought by
Largeman Dental Grp Llc
Current Estimated Value
Home Financials for this Owner
Home Financials are based on the most recent Mortgage that was taken out on this home.
Original Mortgage
$453,734
Interest Rate
2.9%
Mortgage Type
Commercial
Purchase Details
Closed on
Dec 31, 2019
Sold by
St Francis Health Llc
Bought by
St Francis Propco Llc and C/O Lifepoint Health Inc
Purchase Details
Closed on
Dec 30, 2015
Sold by
St Francis Hospital Affili
Bought by
St Francis Health Llc
Purchase Details
Closed on
Sep 5, 2013
Sold by
The Binns Fam Limited L
Bought by
W W Wade Co Llc
Purchase Details
Closed on
Nov 28, 2012
Sold by
Heart Partners Llc
Bought by
St Francis Hospital Affiliated
Create a Home Valuation Report for This Property
The Home Valuation Report is an in-depth analysis detailing your home's value as well as a comparison with similar homes in the area
Home Values in the Area
Average Home Value in this Area
Purchase History
| Date | Buyer | Sale Price | Title Company |
|---|---|---|---|
| Largeman Dental Grp Llc | $560,000 | -- | |
| St Francis Propco Llc | -- | -- | |
| St Francis Health Llc | $42,815,624 | -- | |
| W W Wade Co Llc | $28,190 | -- | |
| St Francis Hospital Affiliated | $1,000,000 | -- |
Source: Public Records
Mortgage History
| Date | Status | Borrower | Loan Amount |
|---|---|---|---|
| Closed | Largeman Dental Grp Llc | $453,734 |
Source: Public Records
Tax History Compared to Growth
Tax History
| Year | Tax Paid | Tax Assessment Tax Assessment Total Assessment is a certain percentage of the fair market value that is determined by local assessors to be the total taxable value of land and additions on the property. | Land | Improvement |
|---|---|---|---|---|
| 2025 | $16,179 | $413,320 | $75,036 | $338,284 |
| 2024 | $16,179 | $413,320 | $75,036 | $338,284 |
| 2023 | $12,721 | $413,320 | $75,036 | $338,284 |
| 2022 | $13,186 | $322,940 | $75,036 | $247,904 |
| 2021 | $9,146 | $224,000 | $75,036 | $148,964 |
| 2020 | $12,774 | $312,762 | $93,792 | $218,970 |
| 2019 | $12,814 | $312,762 | $93,792 | $218,970 |
| 2018 | $11,843 | $340,080 | $93,792 | $246,288 |
| 2017 | $13,978 | $340,080 | $93,792 | $246,288 |
| 2016 | $13,902 | $337,027 | $167,885 | $169,142 |
| 2015 | $13,919 | $337,027 | $167,885 | $169,142 |
| 2014 | $13,936 | $337,027 | $167,885 | $169,142 |
| 2013 | -- | $337,027 | $167,885 | $169,142 |
Source: Public Records
Map
Nearby Homes
- 4419 Anglin Rd
- 3504 Vernon Dr
- 4520 Marci Ct
- 3872 E Britt David Rd
- 4017 River Rock Way
- 4110 Norwood Dr
- 3935 Tifton Dr
- 4047 Sealy Ln
- 3816 Anglin Rd
- 5216 Moon Rd
- 4004 Tifton Dr
- 4133 Pickering Dr
- 4709 Rowland Ave
- 4813 Rowland Ct
- 4807 Fairview Dr
- 3716 University Ave
- 3834 Rockdale Dr
- 10 Conisburgh Ct
- 3409 Primrose Rd
- 4524 Hedingham Ln