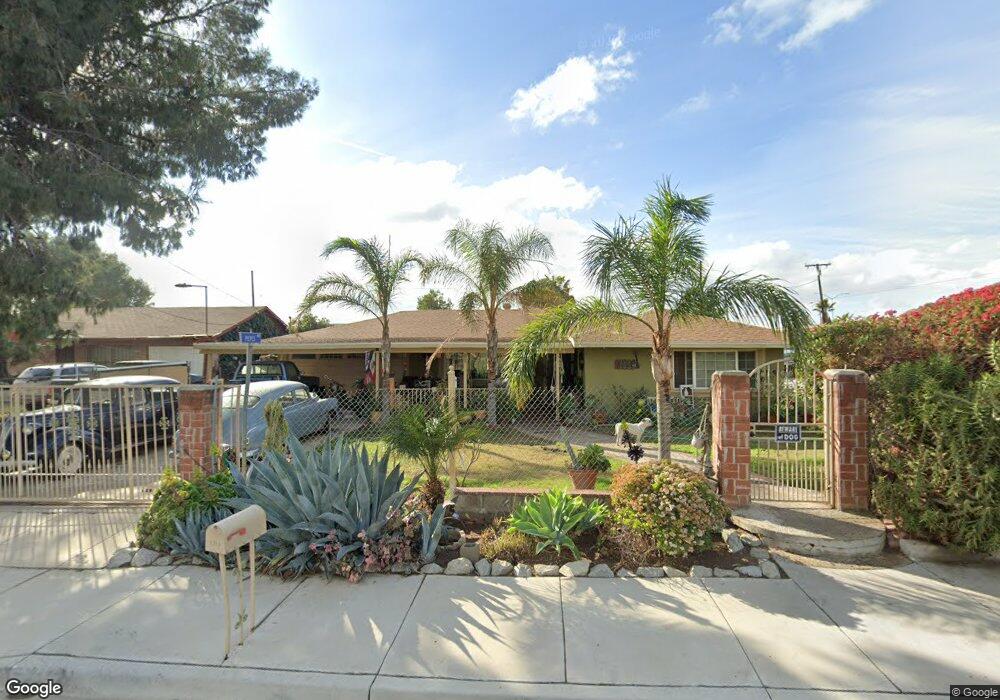
3809 Conning St Riverside, CA 92509
Glen Avon NeighborhoodEstimated Value: $607,256 - $695,000
3
Beds
2
Baths
1,266
Sq Ft
$515/Sq Ft
Est. Value
About This Home
This home is located at 3809 Conning St, Riverside, CA 92509 and is currently estimated at $652,564, approximately $515 per square foot. 3809 Conning St is a home located in Riverside County with nearby schools including Mission Bell Elementary School, Jurupa Middle School, and Patriot High School.
Ownership History
Date
Name
Owned For
Owner Type
Purchase Details
Closed on
Aug 29, 2007
Sold by
Aguirre Jose Luis and Aguirre Angelita
Bought by
Aguirre Cynthia and Aguirre Angelita
Current Estimated Value
Home Financials for this Owner
Home Financials are based on the most recent Mortgage that was taken out on this home.
Original Mortgage
$83,000
Interest Rate
6.67%
Mortgage Type
Stand Alone Refi Refinance Of Original Loan
Purchase Details
Closed on
Aug 16, 2001
Sold by
Aguirre Maria A
Bought by
Aguirre Jose Luis
Purchase Details
Closed on
Mar 15, 2001
Sold by
Macias Angela Ochoa and Aguirre Cynthia
Bought by
Aguirre Jose Luis
Purchase Details
Closed on
Feb 23, 1995
Sold by
Gann Richard D and Gann Robin L
Bought by
Macias Angela Ochoa and Aguirre Cynthia
Home Financials for this Owner
Home Financials are based on the most recent Mortgage that was taken out on this home.
Original Mortgage
$94,727
Interest Rate
8.9%
Mortgage Type
FHA
Create a Home Valuation Report for This Property
The Home Valuation Report is an in-depth analysis detailing your home's value as well as a comparison with similar homes in the area
Home Values in the Area
Average Home Value in this Area
Purchase History
| Date | Buyer | Sale Price | Title Company |
|---|---|---|---|
| Aguirre Cynthia | -- | Ticor Title Company | |
| Aguirre Jose Luis | -- | Landsafe Title | |
| Aguirre Jose Luis | -- | Landsafe Title | |
| Macias Angela Ochoa | $95,000 | Orange Coast Title Co |
Source: Public Records
Mortgage History
| Date | Status | Borrower | Loan Amount |
|---|---|---|---|
| Closed | Aguirre Cynthia | $83,000 | |
| Closed | Macias Angela Ochoa | $94,727 |
Source: Public Records
Tax History
| Year | Tax Paid | Tax Assessment Tax Assessment Total Assessment is a certain percentage of the fair market value that is determined by local assessors to be the total taxable value of land and additions on the property. | Land | Improvement |
|---|---|---|---|---|
| 2025 | $1,906 | $177,248 | $59,076 | $118,172 |
| 2023 | $1,906 | $170,367 | $56,783 | $113,584 |
| 2022 | $1,874 | $167,027 | $55,670 | $111,357 |
| 2021 | $1,860 | $163,753 | $54,579 | $109,174 |
| 2020 | $1,844 | $162,075 | $54,020 | $108,055 |
| 2019 | $1,808 | $158,898 | $52,961 | $105,937 |
| 2018 | $1,750 | $155,783 | $51,924 | $103,859 |
| 2017 | $1,733 | $152,729 | $50,906 | $101,823 |
| 2016 | $1,709 | $149,735 | $49,908 | $99,827 |
| 2015 | $1,686 | $147,488 | $49,159 | $98,329 |
| 2014 | $1,572 | $144,600 | $48,197 | $96,403 |
Source: Public Records
Map
Nearby Homes
- 10025 Mission Blvd
- 9885 Mission Blvd
- 9861 Mission Blvd Unit 14
- 9931 Union St
- 3604 Campbell St
- 0 Fox Tail Ln
- 9468 Hastings Blvd
- 3172 Cabana St
- 4311 Glenroy Ct
- 13966 Green Vista Dr
- 4715 Bain St
- 10492 Latour Ln
- 12006 Glenheather Dr
- 14202 Long View Dr
- 9085 Bellegrave Ave
- 14412 Mountain High Dr
- 4856 Poinsetta Place
- 10544 48th St
- 3700 Quartz Canyon Rd Unit 21
- 4041 Pedley Rd
- 3831 Conning St
- 10036 Ben Nevis Blvd
- 3863 Conning St
- 10040 Ben Nevis Blvd
- 10050 Ben Nevis Blvd
- 3887 Conning St
- 10060 Ben Nevis Blvd
- 10074 Ben Nevis Blvd
- 3810 Conning St
- 10096 Ben Nevis Blvd
- 10093 Granite Hill Dr
- 3752 Conning St
- 3719 Conning St
- 3951 Conning St
- 3750 Conning St
- 3713 Conning St
- 9977 Granite Hill Dr
- 4031 Conning St
- 9965 Granite Hill Dr
- 9910 Ben Nevis Blvd
Your Personal Tour Guide
Ask me questions while you tour the home.