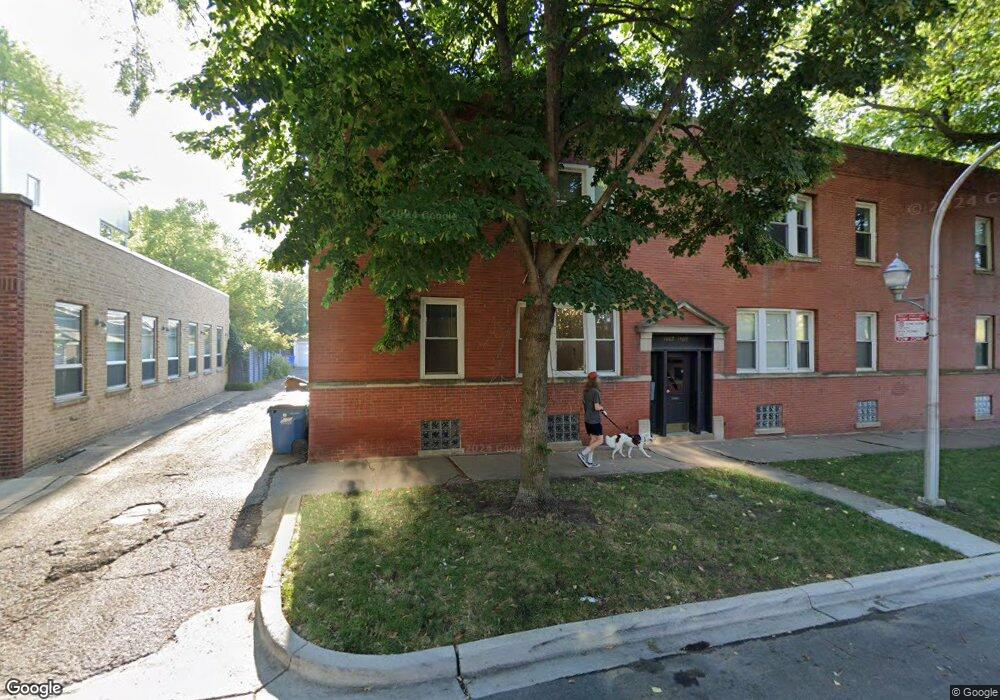
3809 N Ravenswood Ave Unit 3809 Chicago, IL 60613
Southport Corridor NeighborhoodEstimated Value: $288,000 - $304,000
2
Beds
1
Bath
750
Sq Ft
$395/Sq Ft
Est. Value
About This Home
This home is located at 3809 N Ravenswood Ave Unit 3809, Chicago, IL 60613 and is currently estimated at $296,354, approximately $395 per square foot. 3809 N Ravenswood Ave Unit 3809 is a home located in Cook County with nearby schools including Hamilton Elementary School, Lake View High School, and Saint Andrew School.
Ownership History
Date
Name
Owned For
Owner Type
Purchase Details
Closed on
Aug 29, 2019
Sold by
Defazio David and Defazio James
Bought by
Burke Michael and Gorzelany Samantha
Current Estimated Value
Purchase Details
Closed on
Dec 13, 2013
Sold by
Karcz William
Bought by
Defazio David and Defazio James
Home Financials for this Owner
Home Financials are based on the most recent Mortgage that was taken out on this home.
Original Mortgage
$158,400
Interest Rate
4.5%
Mortgage Type
New Conventional
Purchase Details
Closed on
Apr 27, 2005
Sold by
Grace Ravenswood Llc
Bought by
Karcz William
Home Financials for this Owner
Home Financials are based on the most recent Mortgage that was taken out on this home.
Original Mortgage
$191,900
Interest Rate
6.06%
Mortgage Type
Fannie Mae Freddie Mac
Create a Home Valuation Report for This Property
The Home Valuation Report is an in-depth analysis detailing your home's value as well as a comparison with similar homes in the area
Home Values in the Area
Average Home Value in this Area
Purchase History
| Date | Buyer | Sale Price | Title Company |
|---|---|---|---|
| Burke Michael | $217,500 | Fidelity National Title | |
| Defazio David | $198,000 | Git | |
| Karcz William | $240,000 | Multiple |
Source: Public Records
Mortgage History
| Date | Status | Borrower | Loan Amount |
|---|---|---|---|
| Previous Owner | Defazio David | $158,400 | |
| Previous Owner | Karcz William | $191,900 | |
| Closed | Karcz William | $40,800 |
Source: Public Records
Tax History Compared to Growth
Tax History
| Year | Tax Paid | Tax Assessment Tax Assessment Total Assessment is a certain percentage of the fair market value that is determined by local assessors to be the total taxable value of land and additions on the property. | Land | Improvement |
|---|---|---|---|---|
| 2024 | $4,431 | $22,395 | $7,604 | $14,791 |
| 2023 | $4,319 | $21,000 | $6,132 | $14,868 |
| 2022 | $4,319 | $21,000 | $6,132 | $14,868 |
| 2021 | $4,223 | $21,000 | $6,132 | $14,868 |
| 2020 | $3,766 | $16,905 | $2,747 | $14,158 |
| 2019 | $3,012 | $18,423 | $2,747 | $15,676 |
| 2018 | $3,999 | $20,245 | $2,747 | $17,498 |
| 2017 | $3,635 | $16,888 | $2,452 | $14,436 |
| 2016 | $2,882 | $16,888 | $2,452 | $14,436 |
| 2015 | $3,095 | $16,888 | $2,452 | $14,436 |
| 2014 | $3,922 | $21,140 | $1,999 | $19,141 |
| 2013 | $3,367 | $21,140 | $1,999 | $19,141 |
Source: Public Records
Map
Nearby Homes
- 1714 W Grace St Unit 2W
- 3723 N Wolcott Ave
- 1746 W Byron St
- 1801 W Larchmont Ave Unit 306
- 3851 N Hermitage Ave
- 1906 W Byron St Unit 2W
- 1642 W Wolfram St
- 1828 W Larchmont Ave
- 3733 N Damen Ave Unit 1
- 3951 N Hermitage Ave Unit C
- 3822 N Damen Ave Unit 2
- 3621 N Ravenswood Ave
- 4003 N Wolcott Ave Unit F
- 3806 N Ashland Ave Unit 3N
- 3656 N Damen Ave Unit 1
- 1833 W Addison St Unit 2
- 1807 W Addison St Unit 2W
- 3835 N Ashland Ave Unit 1N
- 3814 N Greenview Ave Unit 1
- 4020 N Damen Ave Unit 404
- 3809 N Ravenswood Ave Unit 1
- 3805 N Ravenswood Ave Unit 3805
- 3809 N Ravenswood Ave Unit 3809
- 3805 N Ravenswood Ave Unit 3805
- 3805 N Ravenswood Ave Unit 2
- 3809 N Ravenswood Ave Unit 2
- 3805 N Ravenswood Ave Unit 1
- 3807 N Ravenswood Ave Unit 2
- 3807 N Ravenswood Unit 1
- 3807 N Ravenswood Ave Unit 3807
- 3807 N Ravenswood Ave Unit 3807
- 3807 N Ravenswood Ave
- 3807 N Ravenswood Ave Unit 1
- 1750 W Grace St
- 3811 N Ravenswood Ave
- 3803 N Ravenswood Ave Unit 3803
- 3803 N Ravenswood Ave Unit 3803
- 3803 N Ravenswood Ave Unit 2
- 3803 N Ravenswood Ave Unit 1
- 1748 W Grace St