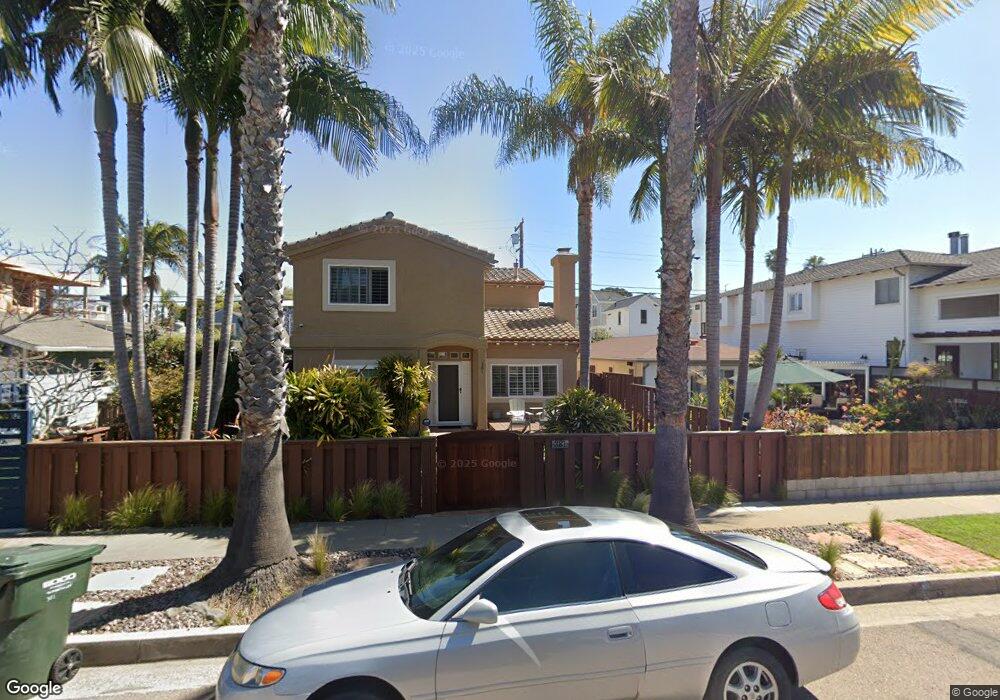
381 La Mesa Ave Encinitas, CA 92024
Central Encinitas NeighborhoodEstimated Value: $1,840,000 - $3,355,000
3
Beds
3
Baths
1,958
Sq Ft
$1,451/Sq Ft
Est. Value
About This Home
This home is located at 381 La Mesa Ave, Encinitas, CA 92024 and is currently estimated at $2,840,271, approximately $1,450 per square foot. 381 La Mesa Ave is a home located in San Diego County with nearby schools including Paul Ecke-Central Elementary, Diegueno Middle School, and La Costa Canyon High School.
Ownership History
Date
Name
Owned For
Owner Type
Purchase Details
Closed on
Sep 1, 2012
Sold by
Manson Christian L and Manson Caliah T
Bought by
Manson Christian L and Manson Caliah T
Current Estimated Value
Purchase Details
Closed on
Jul 8, 2003
Sold by
Huggins George B B and Huggins Denise M
Bought by
Manson Christian and Manson Caliah
Home Financials for this Owner
Home Financials are based on the most recent Mortgage that was taken out on this home.
Original Mortgage
$570,000
Outstanding Balance
$242,883
Interest Rate
5.29%
Mortgage Type
Purchase Money Mortgage
Estimated Equity
$2,597,388
Purchase Details
Closed on
Feb 13, 1997
Sold by
Janet Bremes
Bought by
Huggins George B B and Huggins Danise M
Home Financials for this Owner
Home Financials are based on the most recent Mortgage that was taken out on this home.
Original Mortgage
$346,750
Interest Rate
6.12%
Mortgage Type
Purchase Money Mortgage
Purchase Details
Closed on
Jul 2, 1991
Create a Home Valuation Report for This Property
The Home Valuation Report is an in-depth analysis detailing your home's value as well as a comparison with similar homes in the area
Home Values in the Area
Average Home Value in this Area
Purchase History
| Date | Buyer | Sale Price | Title Company |
|---|---|---|---|
| Manson Christian L | -- | None Available | |
| Manson Christian | $760,000 | Commonwealth Land Title Co | |
| Huggins George B B | $365,000 | Southland Title | |
| -- | $220,000 | -- |
Source: Public Records
Mortgage History
| Date | Status | Borrower | Loan Amount |
|---|---|---|---|
| Open | Manson Christian | $570,000 | |
| Previous Owner | Huggins George B B | $346,750 |
Source: Public Records
Tax History
| Year | Tax Paid | Tax Assessment Tax Assessment Total Assessment is a certain percentage of the fair market value that is determined by local assessors to be the total taxable value of land and additions on the property. | Land | Improvement |
|---|---|---|---|---|
| 2025 | $12,511 | $1,158,484 | $568,711 | $589,773 |
| 2024 | $12,511 | $1,135,769 | $557,560 | $578,209 |
| 2023 | $12,144 | $1,113,500 | $546,628 | $566,872 |
| 2022 | $12,082 | $1,091,667 | $535,910 | $555,757 |
| 2021 | $11,742 | $1,070,262 | $525,402 | $544,860 |
| 2020 | $10,818 | $988,027 | $520,015 | $468,012 |
| 2019 | $10,599 | $968,655 | $509,819 | $458,836 |
| 2018 | $10,431 | $949,663 | $499,823 | $449,840 |
| 2017 | $191 | $931,043 | $490,023 | $441,020 |
| 2016 | $10,042 | $912,788 | $480,415 | $432,373 |
| 2015 | $9,913 | $899,078 | $473,199 | $425,879 |
| 2014 | $9,789 | $881,467 | $463,930 | $417,537 |
Source: Public Records
Map
Nearby Homes
- 498 Neptune Ave
- 510 Neptune Ave
- 523 N Vulcan Ave Unit SPC 24A
- 523 N Vulcan Ave Unit 3
- 523 N Vulcan Ave Unit 41
- 523 N Vulcan Ave Unit 43
- 200 Neptune Ave Unit 2
- 600 N Coast Highway 101
- 215 N Vulcan Ave
- 100 5th St
- 553 Hygeia Ave
- 699 N Vulcan Ave
- 699 N Vulcan Ave Unit 133
- 699 N Vulcan Ave Unit 134
- 699 N Vulcan Ave Unit 80
- 699 N Vulcan Ave Unit 56
- 201 4th St Unit A & B
- 698 Hygeia Ave
- 231 5th St
- 614 Ocean View Ave
- 385 La Mesa Ave
- 375 La Mesa Ave
- 223 S El Portal St Unit 25
- 387 La Mesa Ave Unit 36459643
- 387 La Mesa Ave Unit 36464663
- 387 La Mesa Ave Unit 36439874
- 388 La Veta Ave
- 390 La Veta Ave
- 394 La Veta Ave Unit 96
- 367 La Mesa Ave
- 217 S El Portal St
- 240 S El Portal St
- 370 La Mesa Ave
- 226 S El Portal St
- 366 La Veta Ave
- 365 La Mesa Ave
- 224 El Portal St
- 209 S El Portal St
- 362 La Veta Ave
- 411 La Mesa Ave Unit B
Your Personal Tour Guide
Ask me questions while you tour the home.