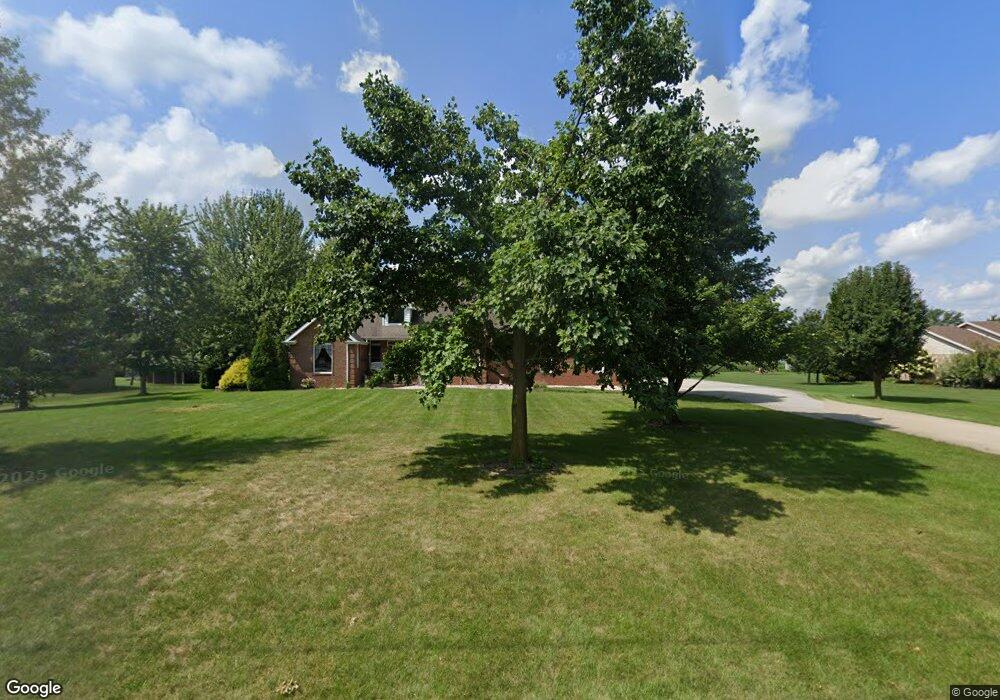
381 N 700 E Greentown, IN 46936
Estimated Value: $291,000 - $453,272
3
Beds
3
Baths
2,185
Sq Ft
$186/Sq Ft
Est. Value
About This Home
This home is located at 381 N 700 E, Greentown, IN 46936 and is currently estimated at $407,318, approximately $186 per square foot. 381 N 700 E is a home located in Howard County with nearby schools including Eastern Elementary School and Eastern High School.
Ownership History
Date
Name
Owned For
Owner Type
Purchase Details
Closed on
Jan 9, 2020
Sold by
Lanning Jeffrey T
Bought by
Lanning Jeffrey T and Lanning Jennifer L
Current Estimated Value
Home Financials for this Owner
Home Financials are based on the most recent Mortgage that was taken out on this home.
Original Mortgage
$174,000
Outstanding Balance
$116,296
Interest Rate
3.6%
Mortgage Type
New Conventional
Estimated Equity
$291,022
Purchase Details
Closed on
Jan 8, 2020
Sold by
Lanning Jeffrey T
Bought by
Lanning Jeffrey T and Lanning Jennifer L
Home Financials for this Owner
Home Financials are based on the most recent Mortgage that was taken out on this home.
Original Mortgage
$174,000
Outstanding Balance
$116,296
Interest Rate
3.6%
Mortgage Type
New Conventional
Estimated Equity
$291,022
Create a Home Valuation Report for This Property
The Home Valuation Report is an in-depth analysis detailing your home's value as well as a comparison with similar homes in the area
Purchase History
| Date | Buyer | Sale Price | Title Company |
|---|---|---|---|
| Lanning Jeffrey T | $231,420 | Maugans J Conrad | |
| Lanning Jeffrey T | -- | None Listed On Document |
Source: Public Records
Mortgage History
| Date | Status | Borrower | Loan Amount |
|---|---|---|---|
| Open | Lanning Jeffrey T | $174,000 | |
| Closed | Lanning Jeffrey T | $174,000 |
Source: Public Records
Tax History
| Year | Tax Paid | Tax Assessment Tax Assessment Total Assessment is a certain percentage of the fair market value that is determined by local assessors to be the total taxable value of land and additions on the property. | Land | Improvement |
|---|---|---|---|---|
| 2025 | $3,951 | $520,900 | $30,500 | $490,400 |
| 2024 | $4,077 | $458,000 | $30,500 | $427,500 |
| 2023 | $4,077 | $417,500 | $30,500 | $387,000 |
| 2022 | $4,116 | $413,500 | $30,500 | $383,000 |
| 2021 | $7,272 | $362,800 | $25,500 | $337,300 |
| 2020 | $3,083 | $319,900 | $25,500 | $294,400 |
| 2019 | $2,606 | $298,400 | $25,500 | $272,900 |
| 2018 | $2,179 | $252,300 | $25,500 | $226,800 |
| 2017 | $2,255 | $251,600 | $26,000 | $225,600 |
| 2016 | $2,199 | $254,400 | $26,000 | $228,400 |
| 2014 | $2,031 | $245,600 | $26,000 | $219,600 |
| 2013 | $1,993 | $238,100 | $26,000 | $212,100 |
Source: Public Records
Map
Nearby Homes
Your Personal Tour Guide
Ask me questions while you tour the home.