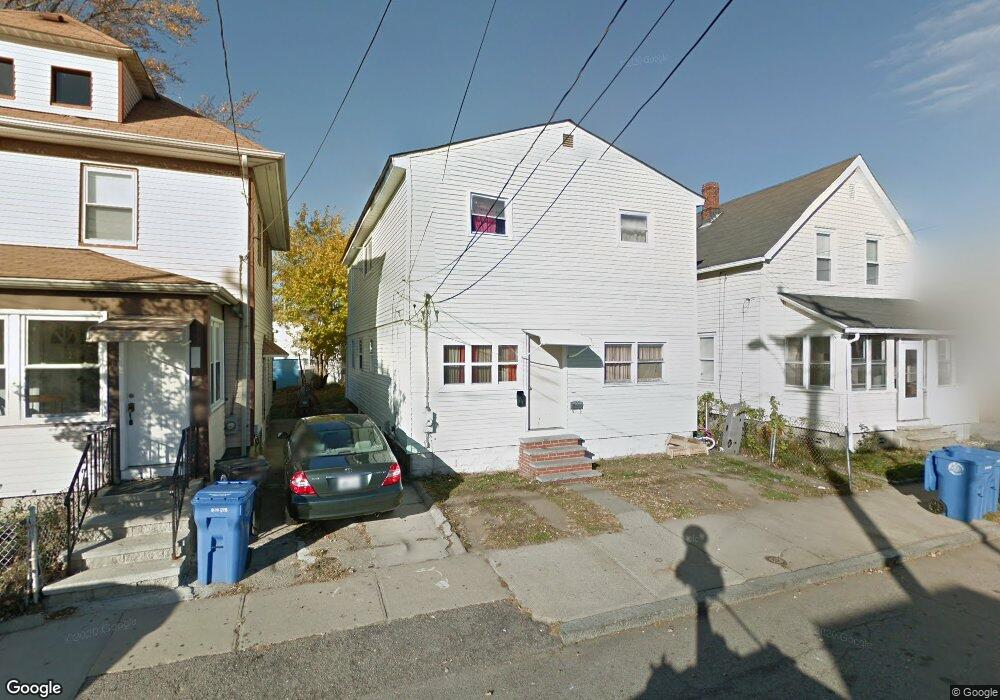
381 Northup St Cranston, RI 02905
Edgewood NeighborhoodEstimated Value: $362,000 - $480,000
5
Beds
2
Baths
1,920
Sq Ft
$224/Sq Ft
Est. Value
About This Home
This home is located at 381 Northup St, Cranston, RI 02905 and is currently estimated at $429,755, approximately $223 per square foot. 381 Northup St is a home located in Providence County with nearby schools including Edgewood Highland Elementary School, Park View Middle School, and Cranston High School East.
Ownership History
Date
Name
Owned For
Owner Type
Purchase Details
Closed on
Jul 16, 2021
Sold by
Yang & Kong Llc
Bought by
Torres Palibio J and Guzman Sahyana M
Current Estimated Value
Home Financials for this Owner
Home Financials are based on the most recent Mortgage that was taken out on this home.
Original Mortgage
$230,743
Outstanding Balance
$208,909
Interest Rate
2.9%
Mortgage Type
FHA
Estimated Equity
$220,846
Create a Home Valuation Report for This Property
The Home Valuation Report is an in-depth analysis detailing your home's value as well as a comparison with similar homes in the area
Home Values in the Area
Average Home Value in this Area
Purchase History
| Date | Buyer | Sale Price | Title Company |
|---|---|---|---|
| Torres Palibio J | $235,000 | None Available |
Source: Public Records
Mortgage History
| Date | Status | Borrower | Loan Amount |
|---|---|---|---|
| Open | Torres Palibio J | $230,743 |
Source: Public Records
Tax History Compared to Growth
Tax History
| Year | Tax Paid | Tax Assessment Tax Assessment Total Assessment is a certain percentage of the fair market value that is determined by local assessors to be the total taxable value of land and additions on the property. | Land | Improvement |
|---|---|---|---|---|
| 2025 | $4,719 | $340,000 | $99,600 | $240,400 |
| 2024 | $4,627 | $340,000 | $99,600 | $240,400 |
| 2023 | $3,933 | $208,100 | $43,700 | $164,400 |
| 2022 | $3,852 | $208,100 | $43,700 | $164,400 |
| 2021 | $3,746 | $208,100 | $43,700 | $164,400 |
| 2020 | $3,732 | $179,700 | $34,300 | $145,400 |
| 2019 | $3,732 | $179,700 | $34,300 | $145,400 |
| 2018 | $1,699 | $179,700 | $34,300 | $145,400 |
| 2017 | $3,040 | $132,500 | $15,600 | $116,900 |
| 2016 | $2,975 | $132,500 | $15,600 | $116,900 |
| 2015 | $2,975 | $132,500 | $15,600 | $116,900 |
| 2014 | $2,364 | $103,500 | $15,600 | $87,900 |
Source: Public Records
Map
Nearby Homes
- 358 Northup St
- 274 Montgomery Ave
- 303 Narragansett St
- 295 Vermont Ave Unit 297
- 243 Bay View Ave
- 61 Cyr St
- 37 Farragut Ave
- 255 Ohio Ave
- 208 California Ave
- 311 Indiana Ave
- 305 Indiana Ave
- 218 Indiana Ave
- 180 Ohio Ave
- 88 Wentworth Ave
- 160 Ohio Ave
- 15 Wheeler Ave
- 52 Cactus St
- 50 Cactus St
- 115 Ohio Ave
- 65 Babcock St
- 385 Northup St
- 377 Northup St
- 391 Northup St
- 369 Northup St
- 298 Montgomery Ave
- 288 Montgomery Ave
- 395 Northup St
- 365 Northup St
- 308 Montgomery Ave
- 374 Northup St
- 284 Montgomery Ave
- 370 Northup St
- 1540 Broad St
- 1548 Broad St
- 395397 Northup St
- 1532 Broad St
- 1530 Broad St
- 366 Northup St
- 359 Northup St
- 357 Northup St