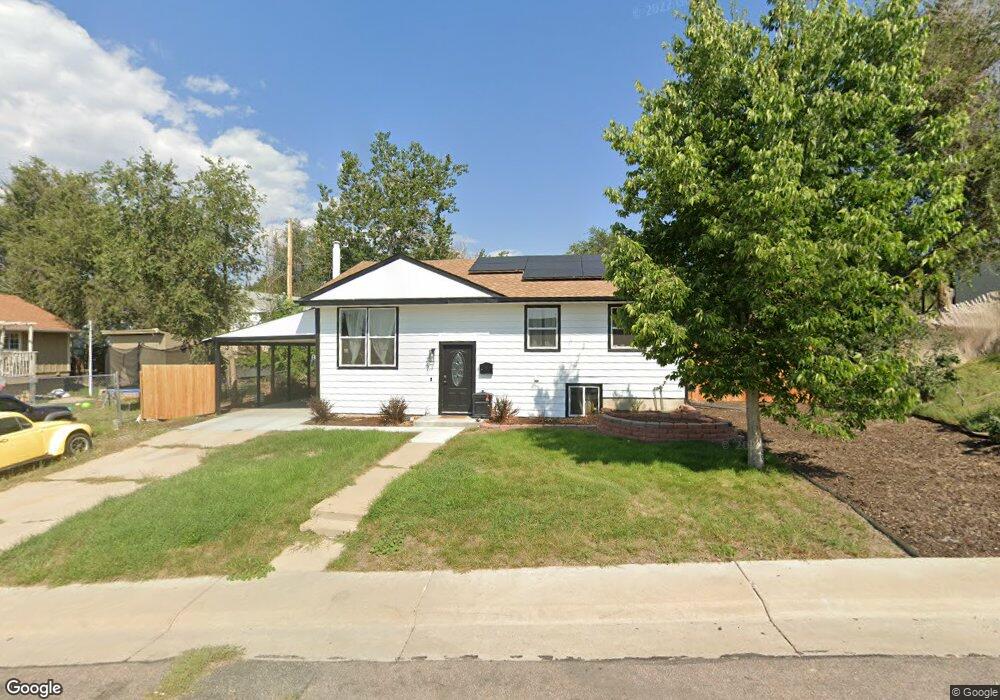
381 W 79th Place Denver, CO 80221
Sherrelwood NeighborhoodEstimated Value: $477,556 - $550,000
4
Beds
2
Baths
1,887
Sq Ft
$270/Sq Ft
Est. Value
About This Home
This home is located at 381 W 79th Place, Denver, CO 80221 and is currently estimated at $509,889, approximately $270 per square foot. 381 W 79th Place is a home located in Adams County with nearby schools including Trailside Academy, The Pinnacle Charter School High School, and The Pinnacle Charter School Elementary.
Ownership History
Date
Name
Owned For
Owner Type
Purchase Details
Closed on
Sep 29, 2020
Sold by
Leigh Douglas
Bought by
Bellitto Lucas Alexander and Wing Shanea Ruybal
Current Estimated Value
Home Financials for this Owner
Home Financials are based on the most recent Mortgage that was taken out on this home.
Original Mortgage
$384,750
Outstanding Balance
$342,215
Interest Rate
2.9%
Mortgage Type
New Conventional
Estimated Equity
$167,674
Purchase Details
Closed on
Feb 24, 2020
Sold by
Thorp Beverly J
Bought by
Leigh Douglas
Purchase Details
Closed on
Jun 28, 2001
Sold by
Thorp Mark F
Bought by
Thorp Mark F and Thorp Beverly J
Home Financials for this Owner
Home Financials are based on the most recent Mortgage that was taken out on this home.
Original Mortgage
$100,000
Interest Rate
7.16%
Mortgage Type
Purchase Money Mortgage
Purchase Details
Closed on
Jun 18, 1993
Create a Home Valuation Report for This Property
The Home Valuation Report is an in-depth analysis detailing your home's value as well as a comparison with similar homes in the area
Home Values in the Area
Average Home Value in this Area
Purchase History
| Date | Buyer | Sale Price | Title Company |
|---|---|---|---|
| Bellitto Lucas Alexander | $405,000 | Land Title Guarantee Co | |
| Leigh Douglas | $257,000 | First Integrity Title | |
| Thorp Mark F | -- | -- | |
| -- | -- | -- |
Source: Public Records
Mortgage History
| Date | Status | Borrower | Loan Amount |
|---|---|---|---|
| Open | Bellitto Lucas Alexander | $384,750 | |
| Previous Owner | Thorp Mark F | $100,000 |
Source: Public Records
Tax History Compared to Growth
Tax History
| Year | Tax Paid | Tax Assessment Tax Assessment Total Assessment is a certain percentage of the fair market value that is determined by local assessors to be the total taxable value of land and additions on the property. | Land | Improvement |
|---|---|---|---|---|
| 2024 | $3,092 | $29,810 | $5,500 | $24,310 |
| 2023 | $3,074 | $34,290 | $5,610 | $28,680 |
| 2022 | $2,555 | $25,370 | $5,770 | $19,600 |
| 2021 | $2,555 | $25,370 | $5,770 | $19,600 |
| 2020 | $2,130 | $21,400 | $5,930 | $15,470 |
| 2019 | $2,193 | $21,400 | $5,930 | $15,470 |
| 2018 | $1,698 | $15,530 | $5,400 | $10,130 |
| 2017 | $1,669 | $15,530 | $5,400 | $10,130 |
| 2016 | $1,351 | $12,230 | $2,950 | $9,280 |
| 2015 | $1,199 | $12,230 | $2,950 | $9,280 |
| 2014 | $1,030 | $10,680 | $2,390 | $8,290 |
Source: Public Records
Map
Nearby Homes
- 261 Elbert Way
- 264 Leona Dr
- 7815 Conifer Rd
- 521 W 78th Place
- 7856 Joan Dr
- 700 Elbert St
- 8271 Bluebell Way
- 8298 Cherokee St
- 7800 Greenwood Blvd
- 7961 Granada Rd
- 7600 Acoma Ct
- 1041 Marigold Dr
- 7950 Patricia Dr
- 7883 Greenwood Blvd
- 7973 Greenwood Blvd
- 1285 Elder St
- 921 Dakin St
- 7609 Sherman Place
- 1325 Elder St
- 8324 Mitze Way
- 361 W 79th Place
- 7984 Conifer Rd
- 7974 Conifer Rd
- 380 W 80th Ave
- 360 W 80th Ave
- 400 W 80th Ave
- 341 W 79th Place
- 380 W 79th Place
- 340 W 80th Ave
- 360 W 79th Place
- 420 W 79th Place
- 320 W 80th Ave
- 321 W 79th Place
- 340 W 79th Place
- 361 El Paso Ct
- 8004 Conifer Rd
- 481 W 79th Place
- 482 W 80th Ave
- 300 W 80th Ave
- 381 El Paso Ct