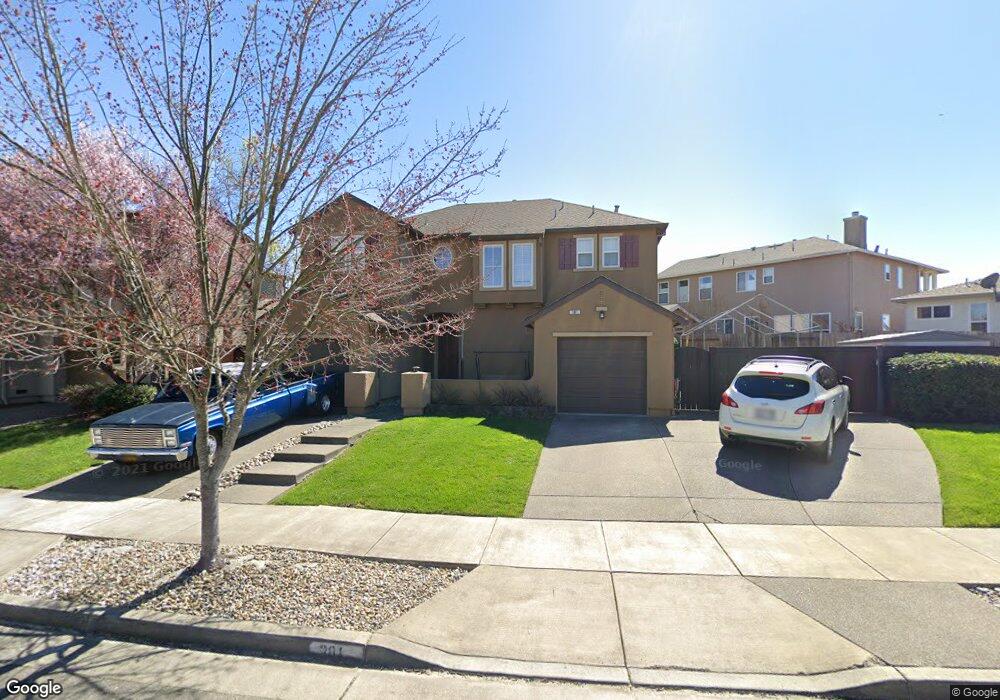
381 Winemaker Way Windsor, CA 95492
Estimated Value: $806,222 - $828,000
3
Beds
3
Baths
1,848
Sq Ft
$443/Sq Ft
Est. Value
About This Home
This home is located at 381 Winemaker Way, Windsor, CA 95492 and is currently estimated at $817,806, approximately $442 per square foot. 381 Winemaker Way is a home located in Sonoma County with nearby schools including Mattie Washburn Elementary School, Brooks Elementary School, and Windsor Middle School.
Ownership History
Date
Name
Owned For
Owner Type
Purchase Details
Closed on
Dec 15, 2021
Sold by
Taylor Kristi K
Bought by
Taylor Kristi K and Kristi Taylor Family Trust
Current Estimated Value
Purchase Details
Closed on
Sep 21, 2017
Sold by
Taylor Kristi K
Bought by
Taylor Kristi K
Home Financials for this Owner
Home Financials are based on the most recent Mortgage that was taken out on this home.
Original Mortgage
$424,100
Outstanding Balance
$354,154
Interest Rate
3.9%
Mortgage Type
New Conventional
Estimated Equity
$463,652
Purchase Details
Closed on
Mar 21, 2005
Sold by
Taylor Nick A
Bought by
Taylor Kristi K
Purchase Details
Closed on
Feb 26, 2001
Sold by
Vintana Ii Lp
Bought by
Mann Kristi K and Taylor Nick A
Home Financials for this Owner
Home Financials are based on the most recent Mortgage that was taken out on this home.
Original Mortgage
$253,676
Interest Rate
6.98%
Create a Home Valuation Report for This Property
The Home Valuation Report is an in-depth analysis detailing your home's value as well as a comparison with similar homes in the area
Home Values in the Area
Average Home Value in this Area
Purchase History
| Date | Buyer | Sale Price | Title Company |
|---|---|---|---|
| Taylor Kristi K | -- | None Available | |
| Taylor Kristi K | -- | Fidelity National Title Co | |
| Taylor Kristi K | -- | -- | |
| Mann Kristi K | $317,500 | North American Title Co |
Source: Public Records
Mortgage History
| Date | Status | Borrower | Loan Amount |
|---|---|---|---|
| Open | Taylor Kristi K | $424,100 | |
| Previous Owner | Mann Kristi K | $253,676 | |
| Closed | Mann Kristi K | $47,564 |
Source: Public Records
Tax History
| Year | Tax Paid | Tax Assessment Tax Assessment Total Assessment is a certain percentage of the fair market value that is determined by local assessors to be the total taxable value of land and additions on the property. | Land | Improvement |
|---|---|---|---|---|
| 2025 | $5,737 | $477,960 | $143,141 | $334,819 |
| 2024 | $5,737 | $468,589 | $140,335 | $328,254 |
| 2023 | $5,737 | $459,402 | $137,584 | $321,818 |
| 2022 | $5,527 | $450,395 | $134,887 | $315,508 |
| 2021 | $5,438 | $441,565 | $132,243 | $309,322 |
| 2020 | $5,554 | $437,039 | $130,888 | $306,151 |
| 2019 | $5,512 | $428,471 | $128,322 | $300,149 |
| 2018 | $5,464 | $420,070 | $125,806 | $294,264 |
| 2017 | $5,413 | $411,835 | $123,340 | $288,495 |
| 2016 | $5,057 | $403,761 | $120,922 | $282,839 |
| 2015 | $4,918 | $397,697 | $119,106 | $278,591 |
| 2014 | $4,843 | $389,907 | $116,773 | $273,134 |
Source: Public Records
Map
Nearby Homes
- 107 Bouquet Cir
- 536 Sauvignon Place
- 8596 Starr Rd
- 7830 Foppiano Way
- 202 Johnson St Unit U14
- 191 Johnson St
- 185 Johnson St
- 125 Johnson St
- 1038 Capewood Ln
- 8145 Willow St
- 472 Emily Rose Cir
- 1138 Broadleaf Ln
- 8182 Willow St
- 9524 Sheffield St
- 1332 Eagle Dr
- 1439 Birdie Dr
- 8156 D St
- 8147 Willow St
- 8148 D St
- 9551 Old Redwood Hwy
- 375 Winemaker Way
- 621 Decanter Cir
- 615 Decanter Cir
- 627 Decanter Cir
- 369 Winemaker Way
- 633 Decanter Cir
- 386 Winemaker Way
- 380 Winemaker Way
- 639 Decanter Cir
- 392 Winemaker Way
- 363 Winemaker Way
- 374 Winemaker Way
- 609 Decanter Cir
- 645 Decanter Cir
- 368 Winemaker Way
- 398 Winemaker Way
- 357 Winemaker Way
- 362 Winemaker Way
- 289 Bouquet Cir
- 632 Decanter Cir
Your Personal Tour Guide
Ask me questions while you tour the home.