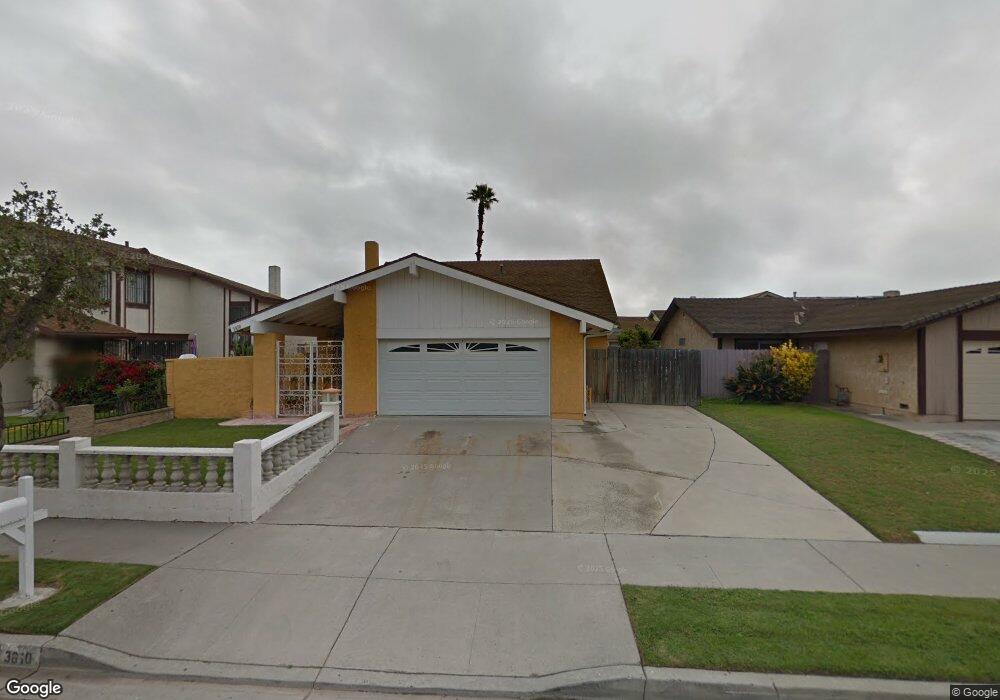
3810 Boston Dr Oxnard, CA 93033
College Estates NeighborhoodEstimated Value: $756,000 - $871,000
4
Beds
3
Baths
2,371
Sq Ft
$341/Sq Ft
Est. Value
About This Home
This home is located at 3810 Boston Dr, Oxnard, CA 93033 and is currently estimated at $807,648, approximately $340 per square foot. 3810 Boston Dr is a home located in Ventura County with nearby schools including Fred L. Williams Elementary School and Channel Islands High School.
Ownership History
Date
Name
Owned For
Owner Type
Purchase Details
Closed on
Jan 6, 2021
Sold by
Covarrubia Eberth A and Covarrubia Edna B
Bought by
Covarrubia Eberth A and Covarrubia Edna B
Current Estimated Value
Home Financials for this Owner
Home Financials are based on the most recent Mortgage that was taken out on this home.
Original Mortgage
$350,000
Interest Rate
2.7%
Mortgage Type
New Conventional
Purchase Details
Closed on
Apr 12, 2005
Sold by
Balanga Covarrubia Edna C and Covarrubia Eberth
Bought by
Covarrubia Eberth A and Covarrubia Edna B
Home Financials for this Owner
Home Financials are based on the most recent Mortgage that was taken out on this home.
Original Mortgage
$425,500
Interest Rate
4.88%
Mortgage Type
New Conventional
Create a Home Valuation Report for This Property
The Home Valuation Report is an in-depth analysis detailing your home's value as well as a comparison with similar homes in the area
Home Values in the Area
Average Home Value in this Area
Purchase History
| Date | Buyer | Sale Price | Title Company |
|---|---|---|---|
| Covarrubia Eberth A | -- | Wfg National Title Company | |
| Covarrubia Eberth A | -- | Wfg National Title Company | |
| Covarrubia Eberth A | -- | Lawyers Title Company |
Source: Public Records
Mortgage History
| Date | Status | Borrower | Loan Amount |
|---|---|---|---|
| Closed | Covarrubia Eberth A | $350,000 | |
| Closed | Covarrubia Eberth A | $425,500 |
Source: Public Records
Tax History
| Year | Tax Paid | Tax Assessment Tax Assessment Total Assessment is a certain percentage of the fair market value that is determined by local assessors to be the total taxable value of land and additions on the property. | Land | Improvement |
|---|---|---|---|---|
| 2025 | $3,364 | $286,887 | $100,400 | $186,487 |
| 2024 | $3,364 | $281,262 | $98,431 | $182,831 |
| 2023 | $3,165 | $275,748 | $96,501 | $179,247 |
| 2022 | $3,099 | $270,342 | $94,609 | $175,733 |
| 2021 | $3,136 | $265,042 | $92,754 | $172,288 |
| 2020 | $3,192 | $262,325 | $91,803 | $170,522 |
| 2019 | $3,095 | $257,182 | $90,003 | $167,179 |
| 2018 | $2,980 | $252,140 | $88,239 | $163,901 |
| 2017 | $2,882 | $247,197 | $86,509 | $160,688 |
| 2016 | $2,744 | $242,351 | $84,813 | $157,538 |
| 2015 | $2,785 | $238,713 | $83,540 | $155,173 |
| 2014 | $2,733 | $234,039 | $81,904 | $152,135 |
Source: Public Records
Map
Nearby Homes
- 860 Morro Way
- 4340 Highland Ave
- 3130 Paula St
- 2117 Cardinal Ave Unit 2117h
- 3151 Fournier St
- 3700 Olds Rd Unit 38
- 3700 Olds Rd Unit 86
- 2167 Robin Ave
- 2178 Thrush Ave Unit J
- 2177 Robin Ave Unit 2177A
- 4221 Justin Way
- 4160 Petit Dr Unit 39
- 360 Ibsen Place Unit 129
- 1407 Peach Ave Unit 14
- 1645 Lime Ave Unit 91
- 622 E Poplar St
- 1657 Lime Ave Unit 87
- 280 Columbia Place Unit 48
- 3631 La Costa Place
- 140 Gaviota Place Unit 157
- 3820 Boston Dr
- 3800 Boston Dr
- 1500 Kipling Ct
- 3830 Boston Dr
- 3740 Boston Dr
- 1501 Kipling Ct
- 3730 Boston Dr
- 1510 Kipling Ct
- 3811 Boston Dr
- 3801 Boston Dr
- 1511 Kipling Ct
- 3821 Boston Dr
- 1501 Lindsay Place
- 1511 Lindsay Place
- 3741 Boston Dr
- 3831 Boston Dr
- 1521 Lindsay Place
- 1600 Kipling Ct
- 3720 Boston Dr
- 1601 Kipling Ct
Your Personal Tour Guide
Ask me questions while you tour the home.