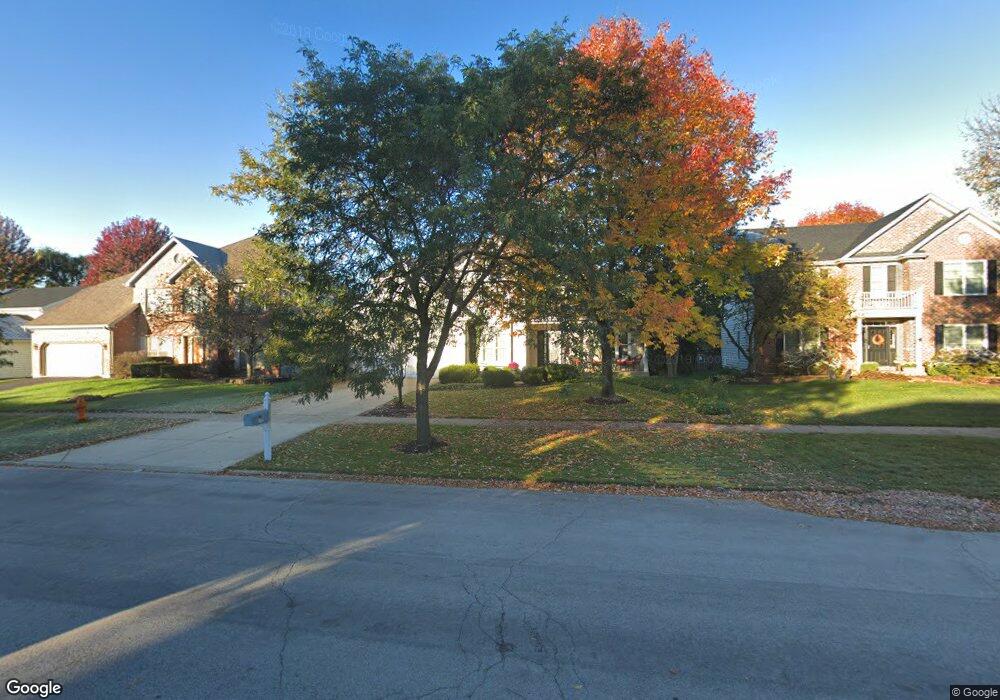
3811 Falkner Dr Naperville, IL 60564
Ashbury NeighborhoodEstimated Value: $701,000 - $782,000
4
Beds
3
Baths
2,642
Sq Ft
$279/Sq Ft
Est. Value
About This Home
This home is located at 3811 Falkner Dr, Naperville, IL 60564 and is currently estimated at $736,665, approximately $278 per square foot. 3811 Falkner Dr is a home located in Will County with nearby schools including Ellsworth Elementary School, Gordon Gregory Middle School, and Neuqua Valley High School.
Ownership History
Date
Name
Owned For
Owner Type
Purchase Details
Closed on
Sep 1, 2005
Sold by
Stender Mark J and Stender Kimberly R
Bought by
Dingens Matthew and Dingens Marilyn
Current Estimated Value
Purchase Details
Closed on
Jun 24, 1997
Sold by
Wilshire Development Corp
Bought by
Stender Mark J and Stender Kimberly R
Home Financials for this Owner
Home Financials are based on the most recent Mortgage that was taken out on this home.
Original Mortgage
$182,500
Interest Rate
8%
Purchase Details
Closed on
Oct 31, 1995
Sold by
Midamerica Development Services Inc
Bought by
Wilshire Development Corp
Home Financials for this Owner
Home Financials are based on the most recent Mortgage that was taken out on this home.
Original Mortgage
$108,600
Interest Rate
7.52%
Create a Home Valuation Report for This Property
The Home Valuation Report is an in-depth analysis detailing your home's value as well as a comparison with similar homes in the area
Home Values in the Area
Average Home Value in this Area
Purchase History
| Date | Buyer | Sale Price | Title Company |
|---|---|---|---|
| Dingens Matthew | $434,000 | First American Title | |
| Stender Mark J | $262,500 | Chicago Title Insurance Co | |
| Wilshire Development Corp | $136,000 | Chicago Title Insurance Co |
Source: Public Records
Mortgage History
| Date | Status | Borrower | Loan Amount |
|---|---|---|---|
| Previous Owner | Stender Mark J | $182,500 | |
| Previous Owner | Wilshire Development Corp | $108,600 |
Source: Public Records
Tax History Compared to Growth
Tax History
| Year | Tax Paid | Tax Assessment Tax Assessment Total Assessment is a certain percentage of the fair market value that is determined by local assessors to be the total taxable value of land and additions on the property. | Land | Improvement |
|---|---|---|---|---|
| 2024 | $12,341 | $196,421 | $65,131 | $131,290 |
| 2023 | $12,341 | $173,517 | $57,536 | $115,981 |
| 2022 | $11,406 | $163,425 | $54,428 | $108,997 |
| 2021 | $10,900 | $155,643 | $51,836 | $103,807 |
| 2020 | $10,693 | $153,177 | $51,015 | $102,162 |
| 2019 | $10,509 | $148,860 | $49,577 | $99,283 |
| 2018 | $10,671 | $148,454 | $48,487 | $99,967 |
| 2017 | $10,507 | $144,621 | $47,235 | $97,386 |
| 2016 | $10,488 | $141,508 | $46,218 | $95,290 |
| 2015 | $10,406 | $136,065 | $44,440 | $91,625 |
| 2014 | $10,406 | $130,431 | $44,440 | $85,991 |
| 2013 | $10,406 | $130,431 | $44,440 | $85,991 |
Source: Public Records
Map
Nearby Homes
- 1112 Saratoga Ct
- 1804 Princess Cir
- 3616 Eliot Ln
- 3816 Rosada Dr
- 1736 Robert Ln
- 3432 Caine Dr
- 3508 Tussell St
- 1116 Hollingswood Ave
- 2255 Wendt Cir
- 3212 Austin Ct
- 1987 Baldwin Way
- 29W316 Andermann Dr
- 945 Winners Cup Ct Unit 945
- 164 Willow Bend
- 3004 Bennett Dr
- 4007 Heron Ct Unit 1
- 1123 Thackery Ln
- 2949 Brossman St
- 2741 Gateshead Dr
- 1834 Marne Rd
- 3807 Falkner Dr
- 3815 Falkner Dr
- 3808 Mandeville Ln
- 3812 Mandeville Ln
- 3819 Falkner Dr
- 1404 Orwell Rd
- 3816 Mandeville Ln
- 1408 Orwell Rd
- 3812 Falkner Dr
- 3808 Falkner Dr
- 3816 Falkner Dr
- 3823 Falkner Dr
- 3820 Falkner Dr
- 1328 Orwell Rd Unit 7
- 3820 Mandeville Ln
- 3824 Falkner Dr
- 3827 Falkner Dr
- 1504 Orwell Rd Unit 7
- 1324 Orwell Rd
- 3811 Mandeville Ln