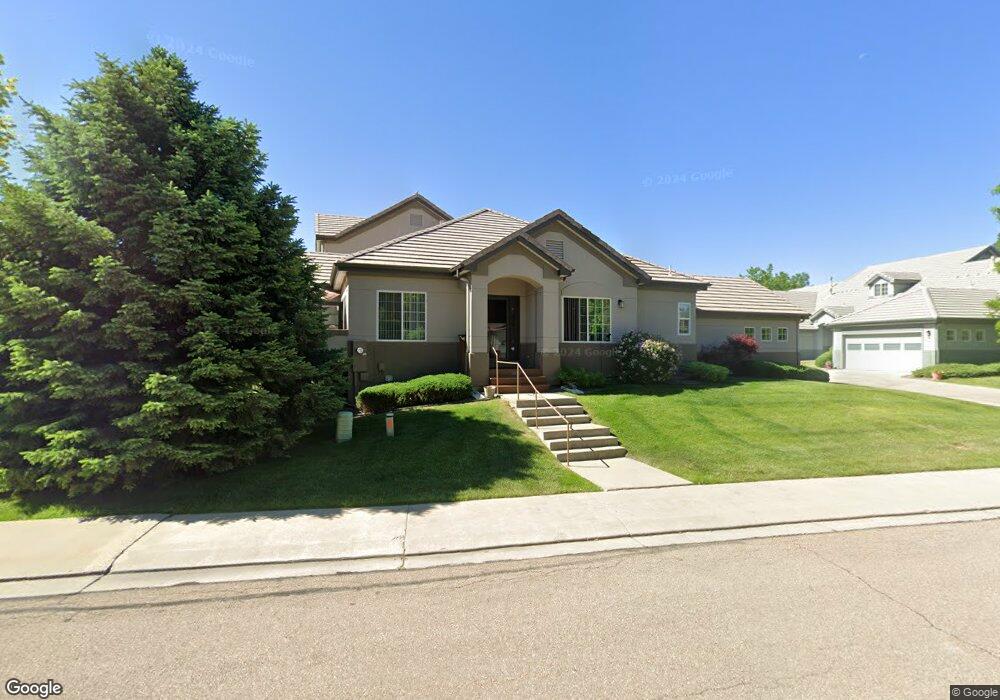
3812 Florentine Cir Unit 3812 Longmont, CO 80503
Upper Clover Basin NeighborhoodEstimated Value: $527,906 - $558,000
3
Beds
3
Baths
2,222
Sq Ft
$242/Sq Ft
Est. Value
About This Home
This home is located at 3812 Florentine Cir Unit 3812, Longmont, CO 80503 and is currently estimated at $538,227, approximately $242 per square foot. 3812 Florentine Cir Unit 3812 is a home located in Boulder County with nearby schools including Eagle Crest Elementary School, Altona Middle School, and Silver Creek High School.
Ownership History
Date
Name
Owned For
Owner Type
Purchase Details
Closed on
Jun 12, 2012
Sold by
Scafe Alfred and Scarfe Olive
Bought by
Scarfe O
Current Estimated Value
Home Financials for this Owner
Home Financials are based on the most recent Mortgage that was taken out on this home.
Original Mortgage
$145,000
Outstanding Balance
$99,780
Interest Rate
3.68%
Mortgage Type
New Conventional
Estimated Equity
$438,447
Purchase Details
Closed on
Oct 6, 2005
Sold by
Scarfe Olive and Scarfe Alfred
Bought by
Scarfe O
Purchase Details
Closed on
Jun 8, 2001
Sold by
Higbee Shane M and Griego Janis L
Bought by
Scarfe Olive
Home Financials for this Owner
Home Financials are based on the most recent Mortgage that was taken out on this home.
Original Mortgage
$215,600
Interest Rate
7.1%
Create a Home Valuation Report for This Property
The Home Valuation Report is an in-depth analysis detailing your home's value as well as a comparison with similar homes in the area
Home Values in the Area
Average Home Value in this Area
Purchase History
| Date | Buyer | Sale Price | Title Company |
|---|---|---|---|
| Scarfe O | -- | Service Link | |
| Scarfe Alfred | -- | Servicelink | |
| Scarfe O | -- | -- | |
| Scarfe Olive | $269,500 | -- | |
| Higbee Shane M | $258,265 | -- |
Source: Public Records
Mortgage History
| Date | Status | Borrower | Loan Amount |
|---|---|---|---|
| Open | Scarfe Alfred | $145,000 | |
| Closed | Scarfe Olive | $215,600 |
Source: Public Records
Tax History Compared to Growth
Tax History
| Year | Tax Paid | Tax Assessment Tax Assessment Total Assessment is a certain percentage of the fair market value that is determined by local assessors to be the total taxable value of land and additions on the property. | Land | Improvement |
|---|---|---|---|---|
| 2025 | $3,423 | $36,913 | $4,950 | $31,963 |
| 2024 | $3,423 | $36,913 | $4,950 | $31,963 |
| 2023 | $3,376 | $35,785 | $5,260 | $34,210 |
| 2022 | $3,160 | $31,928 | $3,982 | $27,946 |
| 2021 | $3,200 | $32,847 | $4,097 | $28,750 |
| 2020 | $3,094 | $31,854 | $3,790 | $28,064 |
| 2019 | $3,046 | $31,854 | $3,790 | $28,064 |
| 2018 | $2,648 | $27,878 | $3,384 | $24,494 |
| 2017 | $2,612 | $30,821 | $3,741 | $27,080 |
| 2016 | $2,324 | $24,310 | $4,856 | $19,454 |
| 2015 | $2,214 | $22,216 | $5,094 | $17,122 |
| 2014 | $2,075 | $22,216 | $5,094 | $17,122 |
Source: Public Records
Map
Nearby Homes
- 1148 Chestnut Dr
- 3742 Florentine Cir Unit 3742
- 1104 Chestnut Dr
- 3600 Quail Rd
- 1108 Chokecherry Ln
- 4101 Da Vinci Dr Unit 4101
- 4033 Hawthorne Cir
- 1004 Chokecherry Ln
- 906 Cranberry Ct
- 1580 Venice Ln
- 1601 Venice Ln
- 791 Thornwood Cir
- 3608 Boxelder Dr
- 3617 Sunflower Cir
- 1667 Venice Ln
- 767 Thornwood Cir
- 690 Stonebridge Dr
- 640 Gooseberry Dr Unit 208
- 640 Gooseberry Dr Unit 904
- 1451 Wildrose Dr
- 3814 Florentine Cir Unit 3814
- 3816 Florentine Cir Unit 3816
- 3816 Florentine Cir Unit 16
- 3810 Florentine Cir Unit 3710
- 3842 Florentine Cir Unit 3842
- 3840 Florentine Cir Unit 3840
- 3808 Florentine Cir Unit 3808
- 3838 Florentine Cir Unit 3838
- 3822 Florentine Cir Unit 3822
- 3806 Florentine Cir Unit 3806
- 3813 Florentine Cir
- 3807 Florentine Cir
- 3804 Florentine Cir Unit 3804
- 3824 Florentine Cir Unit 3824
- 3832 Florentine Cir Unit 3832
- 3802 Florentine Cir Unit 3802
- 3819 Florentine Cir
- 3801 Florentine Cir
- 3800 Florentine Cir Unit 3800
- 3830 Florentine Cir Unit 3830