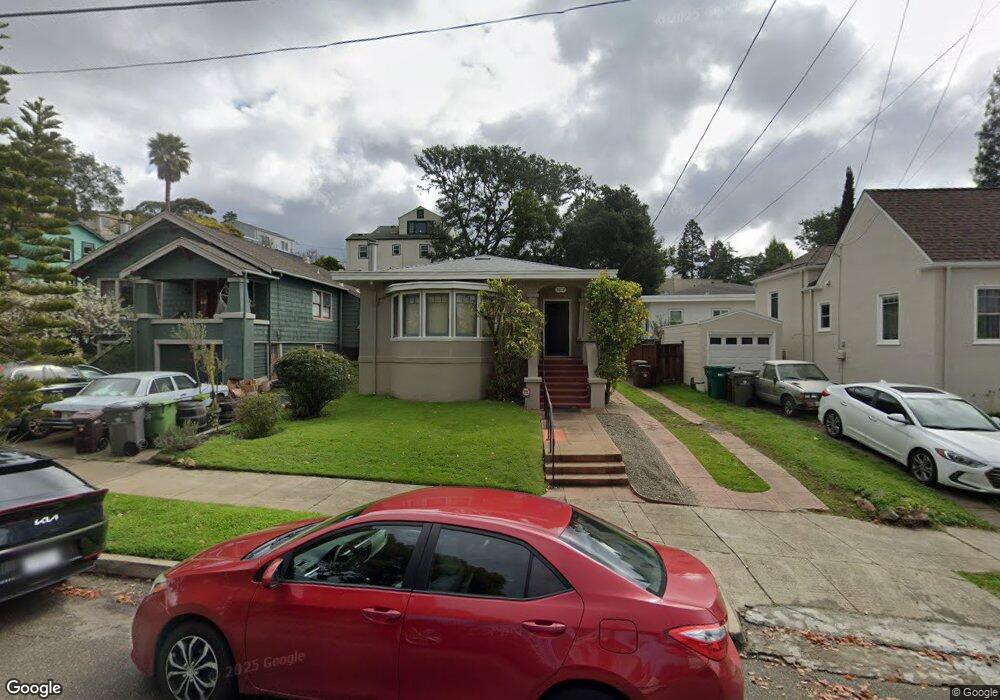
3812 Fruitvale Ave Oakland, CA 94602
Oakmore NeighborhoodEstimated Value: $764,000 - $909,000
2
Beds
1
Bath
1,203
Sq Ft
$680/Sq Ft
Est. Value
About This Home
This home is located at 3812 Fruitvale Ave, Oakland, CA 94602 and is currently estimated at $818,245, approximately $680 per square foot. 3812 Fruitvale Ave is a home located in Alameda County with nearby schools including Sequoia Elementary School, Bret Harte Middle School, and Skyline High School.
Ownership History
Date
Name
Owned For
Owner Type
Purchase Details
Closed on
Dec 29, 2021
Sold by
Asher Family 2003 Trust
Bought by
Asher Family Properties Llc
Current Estimated Value
Purchase Details
Closed on
Feb 1, 2021
Sold by
Asher Narra S and Phillips Asher Exemption Trust
Bought by
Asher Michael R and Asher John D
Purchase Details
Closed on
Apr 3, 2013
Sold by
Asher Narra S and Philips Asher Survivors Trust
Bought by
Asher Narra S and Phillips Asher Survivors Trust
Purchase Details
Closed on
Jul 20, 2012
Sold by
Asher Narra S and Phillips Asher 2003 Revocable
Bought by
Asher Narra S and Phillips Asher Survivors Trust
Purchase Details
Closed on
Nov 7, 2003
Sold by
Narra Phillips Walton M and Narra Asher Phillips
Bought by
Phillips Walton M and Asher Narra S
Purchase Details
Closed on
Apr 4, 2003
Sold by
Narra Phillips Walton M and Narra Asher Phillips
Bought by
Narra Phillips Walton M and Narra Asher Phillips
Create a Home Valuation Report for This Property
The Home Valuation Report is an in-depth analysis detailing your home's value as well as a comparison with similar homes in the area
Home Values in the Area
Average Home Value in this Area
Purchase History
| Date | Buyer | Sale Price | Title Company |
|---|---|---|---|
| Asher Family Properties Llc | -- | None Listed On Document | |
| Asher Michael R | -- | None Available | |
| Asher Narra S | -- | Old Republic Title Company | |
| Asher Narra S | -- | None Available | |
| Phillips Walton M | -- | -- | |
| Narra Phillips Walton M | -- | -- |
Source: Public Records
Tax History Compared to Growth
Tax History
| Year | Tax Paid | Tax Assessment Tax Assessment Total Assessment is a certain percentage of the fair market value that is determined by local assessors to be the total taxable value of land and additions on the property. | Land | Improvement |
|---|---|---|---|---|
| 2025 | $2,615 | $62,029 | $39,473 | $22,556 |
| 2024 | $2,615 | $60,813 | $38,699 | $22,114 |
| 2023 | $2,616 | $59,621 | $37,941 | $21,680 |
| 2022 | $2,472 | $58,452 | $37,197 | $21,255 |
| 2021 | $2,203 | $57,305 | $36,467 | $20,838 |
| 2020 | $2,177 | $56,719 | $36,094 | $20,625 |
| 2019 | $1,994 | $55,606 | $35,386 | $20,220 |
| 2018 | $1,957 | $54,516 | $34,692 | $19,824 |
| 2017 | $1,845 | $53,447 | $34,012 | $19,435 |
| 2016 | $1,688 | $52,399 | $33,345 | $19,054 |
| 2015 | $1,675 | $51,612 | $32,844 | $18,768 |
| 2014 | $1,573 | $50,601 | $32,201 | $18,400 |
Source: Public Records
Map
Nearby Homes
- 3847 Fruitvale Ave
- 3887 Forest Hill Ave
- 3826 Lincoln Ave
- 2240 Macarthur Blvd
- 3541 Dimond Ave
- 2510 Delmer St
- 3477 Boston Ave Unit 4
- 3853 Rhoda Ave
- 2436 Potomac St
- 1515 Hampel St
- 2726 Madeline St
- 2715 Macarthur Blvd
- 4081 Waterhouse Rd
- 3873 Coolidge Ave
- 3875 Coolidge Ave
- 2471 Burlington St
- 4426 Park Blvd
- 3220 Champion St
- 2808 Carmel St
- 4019 Rhoda Ave
- 3818 Fruitvale Ave
- 3800 Fruitvale Ave
- 3809 Whittle Ave
- 3826 Fruitvale Ave
- 3809 Forest Hill Ave
- 3801 Forest Hill Ave
- 3817 Forest Hill Ave
- 3834 Fruitvale Ave
- 3801 Fruitvale Ave
- 3840 Fruitvale Ave
- 3809 Fruitvale Ave
- 3811 Fruitvale Ave
- 3829 Forest Hill Ave
- 3817 Fruitvale Ave
- 3825 Fruitvale Ave
- 3837 Fruitvale Ave
- 3846 Fruitvale Ave
- 3814 Whittle Ave
- 3779 Fruitvale Ave
- 3829 Whittle Ave