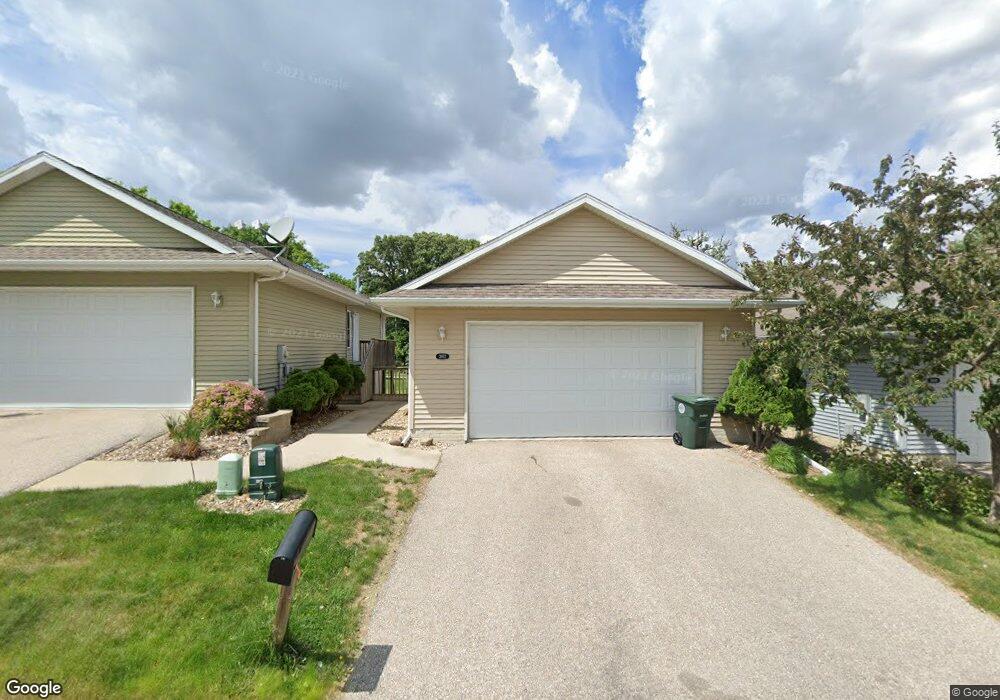
3812 Jay Ln Waterloo, IA 50701
Estimated Value: $181,000 - $187,545
2
Beds
2
Baths
600
Sq Ft
$305/Sq Ft
Est. Value
About This Home
This home is located at 3812 Jay Ln, Waterloo, IA 50701 and is currently estimated at $183,136, approximately $305 per square foot. 3812 Jay Ln is a home located in Black Hawk County with nearby schools including Cedar Heights Elementary School, Peet Junior High School, and Cedar Falls High School.
Ownership History
Date
Name
Owned For
Owner Type
Purchase Details
Closed on
Jan 26, 2022
Sold by
C & S Real Estate Ii Llc
Bought by
Laidig Tim and Laidig Mary
Current Estimated Value
Purchase Details
Closed on
Nov 12, 2015
Sold by
Mulcahy Shawn and Mulcahy Heather Ann
Bought by
C&S Real Estate Ii Llc
Purchase Details
Closed on
Oct 26, 2015
Sold by
Bank Of America National Association
Bought by
Mulcahy Shawn D
Purchase Details
Closed on
Sep 23, 2015
Sold by
Sheriff Of Black Hawk County and Kimball Harvey L
Bought by
Bank Of America National Association
Purchase Details
Closed on
Nov 30, 2007
Sold by
Joe Minard Construction Inc
Bought by
Kimball Ii Harvey L
Home Financials for this Owner
Home Financials are based on the most recent Mortgage that was taken out on this home.
Original Mortgage
$133,119
Interest Rate
6.33%
Mortgage Type
FHA
Create a Home Valuation Report for This Property
The Home Valuation Report is an in-depth analysis detailing your home's value as well as a comparison with similar homes in the area
Purchase History
| Date | Buyer | Sale Price | Title Company |
|---|---|---|---|
| Laidig Tim | -- | None Listed On Document | |
| C&S Real Estate Ii Llc | -- | None Available | |
| Mulcahy Shawn D | $95,500 | None Available | |
| Bank Of America National Association | $115,920 | None Available | |
| Kimball Ii Harvey L | $134,500 | Title Services |
Source: Public Records
Mortgage History
| Date | Status | Borrower | Loan Amount |
|---|---|---|---|
| Previous Owner | Kimball Ii Harvey L | $133,119 |
Source: Public Records
Tax History
| Year | Tax Paid | Tax Assessment Tax Assessment Total Assessment is a certain percentage of the fair market value that is determined by local assessors to be the total taxable value of land and additions on the property. | Land | Improvement |
|---|---|---|---|---|
| 2025 | $3,294 | $171,690 | $24,330 | $147,360 |
| 2024 | $3,294 | $159,620 | $24,330 | $135,290 |
| 2023 | $2,852 | $159,620 | $24,330 | $135,290 |
| 2022 | $2,816 | $123,900 | $24,330 | $99,570 |
| 2021 | $2,500 | $123,900 | $24,330 | $99,570 |
| 2020 | $2,434 | $110,060 | $15,320 | $94,740 |
| 2019 | $2,434 | $110,060 | $15,320 | $94,740 |
| 2018 | $2,352 | $107,160 | $15,320 | $91,840 |
| 2017 | $2,308 | $107,160 | $15,320 | $91,840 |
| 2016 | $2,100 | $102,320 | $15,320 | $87,000 |
| 2015 | $2,100 | $102,320 | $15,320 | $87,000 |
| 2014 | $2,114 | $102,320 | $15,320 | $87,000 |
Source: Public Records
Map
Nearby Homes
- 456 Loma St
- 2009 Wembley Rd
- 2117 Tilbury Rd
- 3314 Scenic Dr
- 328 Drynan Dr
- 3230 Terrace Dr
- 301 S Hackett Rd
- 0 Bergen Dr
- 108 Helen Rd
- 1712 Rainbow Dr
- 412 Hughes Dr
- 2151 Grand Blvd
- 320 Valley Rd
- 4015 Cedar Heights Dr Unit 7
- 4015 Cedar Heights Dr Unit 9
- 4015 Cedar Heights Dr Unit 11
- 4015 Cedar Heights Dr Unit 4
- 4015 Cedar Heights Dr Unit 6
- 4015 Cedar Heights Dr Unit 2
- 4015 Cedar Heights Dr Unit 10
Your Personal Tour Guide
Ask me questions while you tour the home.