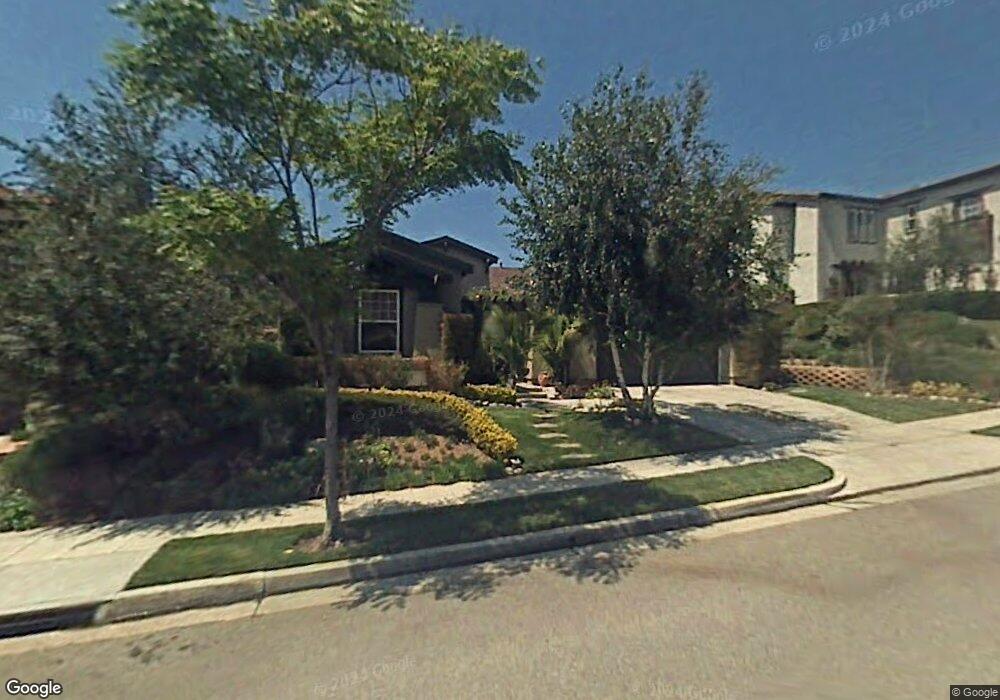
3813 Luna Ct Altadena, CA 91001
Estimated Value: $1,496,000 - $2,063,000
4
Beds
4
Baths
3,196
Sq Ft
$551/Sq Ft
Est. Value
About This Home
This home is located at 3813 Luna Ct, Altadena, CA 91001 and is currently estimated at $1,761,066, approximately $551 per square foot. 3813 Luna Ct is a home located in Los Angeles County with nearby schools including Charles W. Eliot Arts Magnet Academy, John Muir High School, and Odyssey Charter School.
Ownership History
Date
Name
Owned For
Owner Type
Purchase Details
Closed on
Jul 9, 2001
Sold by
Rabbani Ramin and Kamarei Shaparak
Bought by
Moore Eustace and Moore Alycia Gardner
Current Estimated Value
Purchase Details
Closed on
Mar 10, 2000
Sold by
Kaplan Paul A and Norment Robert
Bought by
Rabbani Ramin and Kamarei Shaparak
Home Financials for this Owner
Home Financials are based on the most recent Mortgage that was taken out on this home.
Original Mortgage
$429,400
Interest Rate
7.5%
Purchase Details
Closed on
Aug 10, 1999
Sold by
Southwest Diversified La Vina Ltd
Bought by
Kaplan Paul A and Norment Robert
Home Financials for this Owner
Home Financials are based on the most recent Mortgage that was taken out on this home.
Original Mortgage
$360,400
Interest Rate
7.66%
Create a Home Valuation Report for This Property
The Home Valuation Report is an in-depth analysis detailing your home's value as well as a comparison with similar homes in the area
Home Values in the Area
Average Home Value in this Area
Purchase History
| Date | Buyer | Sale Price | Title Company |
|---|---|---|---|
| Moore Eustace | $604,500 | Equity Title | |
| Rabbani Ramin | $488,000 | Southland Title | |
| Kaplan Paul A | $451,000 | First American Title Co |
Source: Public Records
Mortgage History
| Date | Status | Borrower | Loan Amount |
|---|---|---|---|
| Previous Owner | Rabbani Ramin | $429,400 | |
| Previous Owner | Kaplan Paul A | $360,400 | |
| Closed | Kaplan Paul A | $67,550 |
Source: Public Records
Tax History Compared to Growth
Tax History
| Year | Tax Paid | Tax Assessment Tax Assessment Total Assessment is a certain percentage of the fair market value that is determined by local assessors to be the total taxable value of land and additions on the property. | Land | Improvement |
|---|---|---|---|---|
| 2025 | $12,579 | $856,224 | $275,609 | $580,615 |
| 2024 | $12,579 | $875,209 | $300,228 | $574,981 |
| 2023 | $12,335 | $858,049 | $294,342 | $563,707 |
| 2022 | $11,883 | $841,225 | $288,571 | $552,654 |
| 2021 | $11,448 | $824,731 | $282,913 | $541,818 |
| 2019 | $11,056 | $800,272 | $274,523 | $525,749 |
| 2018 | $11,148 | $784,582 | $269,141 | $515,441 |
| 2016 | $10,782 | $754,118 | $258,691 | $495,427 |
| 2015 | $10,676 | $742,792 | $254,806 | $487,986 |
| 2014 | $10,466 | $728,243 | $249,815 | $478,428 |
Source: Public Records
Map
Nearby Homes
- 3769 N Hollingsworth Rd
- 3751 N Hollingsworth Rd
- 605 Coate Ct
- 3731 N Hollingsworth Rd
- 3873 Lilac Canyon Ln
- 3748 Sunset Ridge Rd
- 3903 Lilac Canyon Ln
- 3911 Lilac Canyon Ln
- Residence Two Plan at Encore at La Vina
- Residence One Plan at Encore at La Vina
- Residence Three Plan at Encore at La Vina
- 827 W Heritage Oak Ct
- 820 Millard Canyon Rd
- 632 Hartwell Ct
- 749 Via Arezzo Place
- 637 Chaparral Ct
- 3921 Chapman Ct
- 3740 Canyon Crest Rd
- 3624 Canyon Crest Rd
- 4156 Aralia Rd
- 3821 Luna Ct
- 3805 Luna Ct
- 3829 Luna Ct
- 3814 Luna Ct
- 637 Coate Ct
- 3824 Luna Ct
- 674 Millard Canyon Rd
- 670 Millard Canyon Rd
- 3835 Luna Ct
- 712 Millard Canyon Rd
- 3763 N Hollingsworth Rd
- 3832 Luna Ct
- 664 Millard Canyon Rd
- 633 Coate Ct
- 632 Coate Ct
- 718 Millard Canyon Rd
- 3760 N Hollingsworth Rd
- 3759 N Hollingsworth Rd
- 658 Millard Canyon Rd
- 629 Coate Ct