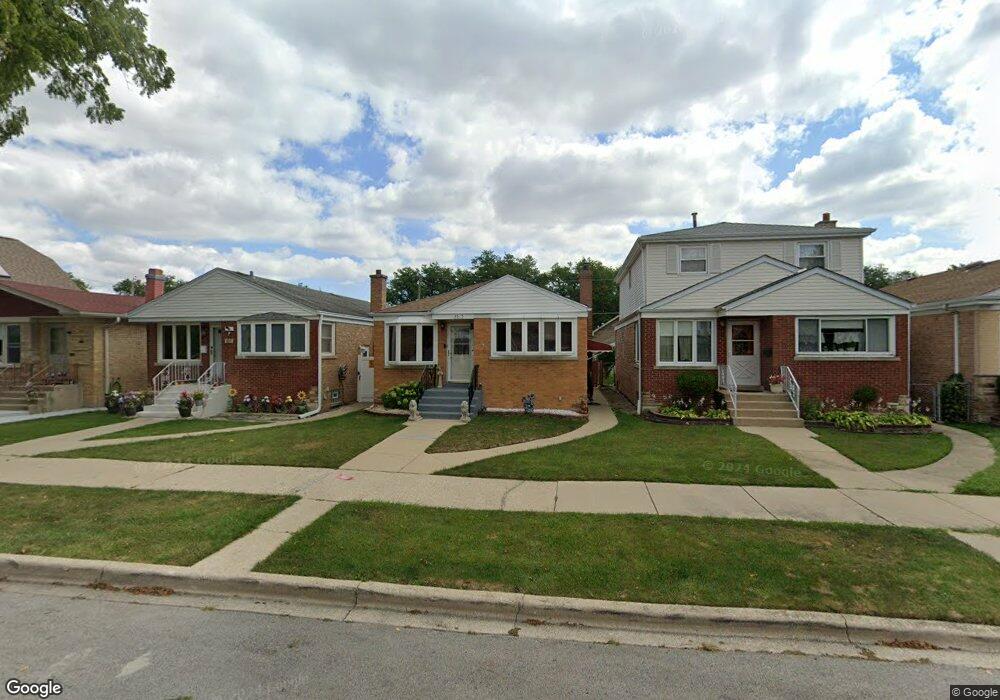
3815 N Osceola Ave Chicago, IL 60634
Belmont Heights NeighborhoodEstimated Value: $364,142 - $427,000
3
Beds
1
Bath
931
Sq Ft
$434/Sq Ft
Est. Value
About This Home
This home is located at 3815 N Osceola Ave, Chicago, IL 60634 and is currently estimated at $404,286, approximately $434 per square foot. 3815 N Osceola Ave is a home located in Cook County with nearby schools including Dever Elementary School, Steinmetz College Prep, and St. Francis Borgia School.
Ownership History
Date
Name
Owned For
Owner Type
Purchase Details
Closed on
Aug 15, 2005
Sold by
Jedynak Janusz and Jedynak Zuzanna
Bought by
Pena German and Pena Gloria Vilma
Current Estimated Value
Home Financials for this Owner
Home Financials are based on the most recent Mortgage that was taken out on this home.
Original Mortgage
$296,000
Outstanding Balance
$107,815
Interest Rate
1%
Mortgage Type
New Conventional
Estimated Equity
$296,471
Purchase Details
Closed on
Apr 22, 2002
Sold by
Jones Sheryl L
Bought by
Jedynak Janusz and Jedynak Zuzanna
Home Financials for this Owner
Home Financials are based on the most recent Mortgage that was taken out on this home.
Original Mortgage
$202,500
Interest Rate
7.18%
Purchase Details
Closed on
Jan 7, 1994
Sold by
Powell Clarence A
Bought by
Jones Sheryl L
Home Financials for this Owner
Home Financials are based on the most recent Mortgage that was taken out on this home.
Original Mortgage
$101,000
Interest Rate
7.29%
Create a Home Valuation Report for This Property
The Home Valuation Report is an in-depth analysis detailing your home's value as well as a comparison with similar homes in the area
Home Values in the Area
Average Home Value in this Area
Purchase History
| Date | Buyer | Sale Price | Title Company |
|---|---|---|---|
| Pena German | $370,000 | First American Title Ins Co | |
| Jedynak Janusz | $225,000 | -- | |
| Jones Sheryl L | $80,666 | -- |
Source: Public Records
Mortgage History
| Date | Status | Borrower | Loan Amount |
|---|---|---|---|
| Open | Pena German | $296,000 | |
| Previous Owner | Jedynak Janusz | $202,500 | |
| Previous Owner | Jones Sheryl L | $101,000 |
Source: Public Records
Tax History Compared to Growth
Tax History
| Year | Tax Paid | Tax Assessment Tax Assessment Total Assessment is a certain percentage of the fair market value that is determined by local assessors to be the total taxable value of land and additions on the property. | Land | Improvement |
|---|---|---|---|---|
| 2024 | $4,227 | $27,000 | $9,225 | $17,775 |
| 2023 | $3,941 | $26,000 | $7,380 | $18,620 |
| 2022 | $3,941 | $26,000 | $7,380 | $18,620 |
| 2021 | $4,559 | $26,003 | $7,383 | $18,620 |
| 2020 | $3,398 | $18,356 | $4,612 | $13,744 |
| 2019 | $3,409 | $20,396 | $4,612 | $15,784 |
| 2018 | $3,350 | $20,396 | $4,612 | $15,784 |
| 2017 | $3,859 | $21,300 | $4,059 | $17,241 |
| 2016 | $3,766 | $21,300 | $4,059 | $17,241 |
| 2015 | $3,422 | $21,300 | $4,059 | $17,241 |
| 2014 | $3,210 | $19,869 | $3,690 | $16,179 |
| 2013 | $3,135 | $19,869 | $3,690 | $16,179 |
Source: Public Records
Map
Nearby Homes
- 7431 W Forest Preserve Ave
- 3925 N Olcott Ave
- 3929 N Oleander Ave
- 3952 N Oleander Ave
- 3638 N Odell Ave
- 3919 N Oriole Ave
- 3721 N Octavia Ave
- 3924 N Oconto Ave
- 3615 N Osceola Ave
- 7408 W Addison St
- 4016 N Odell Ave
- 3630 N Harlem Ave Unit 510
- 3630 N Harlem Ave Unit 205
- 7649 W Irving Park Rd
- 3649 N Overhill Ave
- 3518 N Odell Ave
- 7707 W Irving Park Rd Unit 303
- 3507 N Osceola Ave
- 3947 N Neva Ave
- 3518 N Oleander Ave
- 3811 N Osceola Ave
- 3817 N Osceola Ave
- 3809 N Osceola Ave
- 3821 N Osceola Ave
- 3807 N Osceola Ave
- 3823 N Osceola Ave
- 3805 N Osceola Ave
- 3825 N Osceola Ave
- 3801 N Osceola Ave
- 3814 N Oketo Ave
- 3812 N Oketo Ave
- 3816 N Oketo Ave
- 3829 N Osceola Ave
- 3820 N Oketo Ave
- 3810 N Oketo Ave
- 3822 N Oketo Ave
- 3804 N Oketo Ave
- 3831 N Osceola Ave
- 3824 N Oketo Ave
- 3814 N Osceola Ave