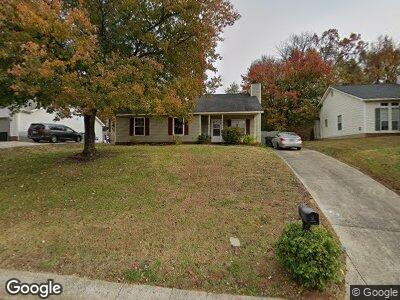
3818 Hunters Run Ln Matthews, NC 28105
Marshbrooke NeighborhoodEstimated Value: $283,000 - $304,000
3
Beds
2
Baths
978
Sq Ft
$299/Sq Ft
Est. Value
About This Home
This home is located at 3818 Hunters Run Ln, Matthews, NC 28105 and is currently estimated at $292,841, approximately $299 per square foot. 3818 Hunters Run Ln is a home located in Mecklenburg County with nearby schools including Crown Point Elementary, Mint Hill Middle School, and Butler High School.
Ownership History
Date
Name
Owned For
Owner Type
Purchase Details
Closed on
Jan 9, 2024
Sold by
Johnson Valerie R
Bought by
Johnson-Abney Rolanda
Current Estimated Value
Purchase Details
Closed on
Apr 28, 2011
Sold by
Household Realty Corporation
Bought by
Johnson Valerie R
Home Financials for this Owner
Home Financials are based on the most recent Mortgage that was taken out on this home.
Original Mortgage
$40,000
Interest Rate
4.85%
Mortgage Type
New Conventional
Purchase Details
Closed on
Dec 13, 2010
Sold by
Hough Linda and Hough Terry
Bought by
Household Realty Corporation
Purchase Details
Closed on
Nov 29, 2005
Sold by
Connolly Erin J
Bought by
Hough Linda
Home Financials for this Owner
Home Financials are based on the most recent Mortgage that was taken out on this home.
Original Mortgage
$77,920
Interest Rate
7.85%
Mortgage Type
Fannie Mae Freddie Mac
Create a Home Valuation Report for This Property
The Home Valuation Report is an in-depth analysis detailing your home's value as well as a comparison with similar homes in the area
Home Values in the Area
Average Home Value in this Area
Purchase History
| Date | Buyer | Sale Price | Title Company |
|---|---|---|---|
| Johnson-Abney Rolanda | -- | None Listed On Document | |
| Johnson Valerie R | $50,000 | None Available | |
| Household Realty Corporation | -- | None Available | |
| Hough Linda | $97,500 | -- |
Source: Public Records
Mortgage History
| Date | Status | Borrower | Loan Amount |
|---|---|---|---|
| Previous Owner | Johnson Valerie R | $40,000 | |
| Previous Owner | Hough Linda | $91,918 | |
| Previous Owner | Hough Linda | $77,920 | |
| Previous Owner | Connolly Erin J | $23,966 |
Source: Public Records
Tax History Compared to Growth
Tax History
| Year | Tax Paid | Tax Assessment Tax Assessment Total Assessment is a certain percentage of the fair market value that is determined by local assessors to be the total taxable value of land and additions on the property. | Land | Improvement |
|---|---|---|---|---|
| 2023 | $2,036 | $258,600 | $80,000 | $178,600 |
| 2022 | $1,631 | $156,000 | $50,000 | $106,000 |
| 2021 | $1,620 | $156,000 | $50,000 | $106,000 |
| 2020 | $1,613 | $156,000 | $50,000 | $106,000 |
| 2019 | $1,597 | $156,000 | $50,000 | $106,000 |
| 2018 | $1,384 | $99,900 | $23,800 | $76,100 |
| 2017 | $1,356 | $99,900 | $23,800 | $76,100 |
| 2016 | $1,347 | $99,900 | $23,800 | $76,100 |
| 2015 | $1,335 | $99,900 | $23,800 | $76,100 |
| 2014 | $1,361 | $101,100 | $25,000 | $76,100 |
Source: Public Records
Map
Nearby Homes
- 3801 Rosedown Dr
- 9617 Farmridge Ln
- 8702 Wood Sorrel Ct
- 3703 Margaret Wallace Rd
- 3012 Longspur Dr
- 3643 Melrose Cottage Dr
- 4013 Grommet Ct
- 4013 Grommet Ct
- 4013 Grommet Ct
- 4013 Grommet Ct
- 4017 Grommet Ct
- 3602 Melrose Cottage Dr
- 3736 Melrose Cottage Dr
- 4021 Grommet Ct
- 4025 Grommet Ct
- 3610 Melrose Cottage Dr
- 9108 Clifton Meadow Dr
- 4029 Grommet Ct
- 4033 Grommet Ct
- 9021 Louvaine Dr
- 3818 Hunters Run Ln
- 3824 Hunters Run Ln
- 3812 Hunters Run Ln
- 3821 Rosedown Dr
- 3825 Rosedown Dr
- 3828 Hunters Run Ln
- 3806 Hunters Run Ln
- 3817 Rosedown Dr
- 3831 Rosedown Dr
- 3813 Rosedown Dr
- 3817 Hunters Run Ln
- 3821 Hunters Run Ln
- 3813 Hunters Run Ln
- 3800 Hunters Run Ln
- 3825 Hunters Run Ln
- 3809 Rosedown Dr
- 3807 Hunters Run Ln
- 9601 Farm Ridge Ln
- 9601 Farmridge Ln
- 3801 Hunters Run Ln