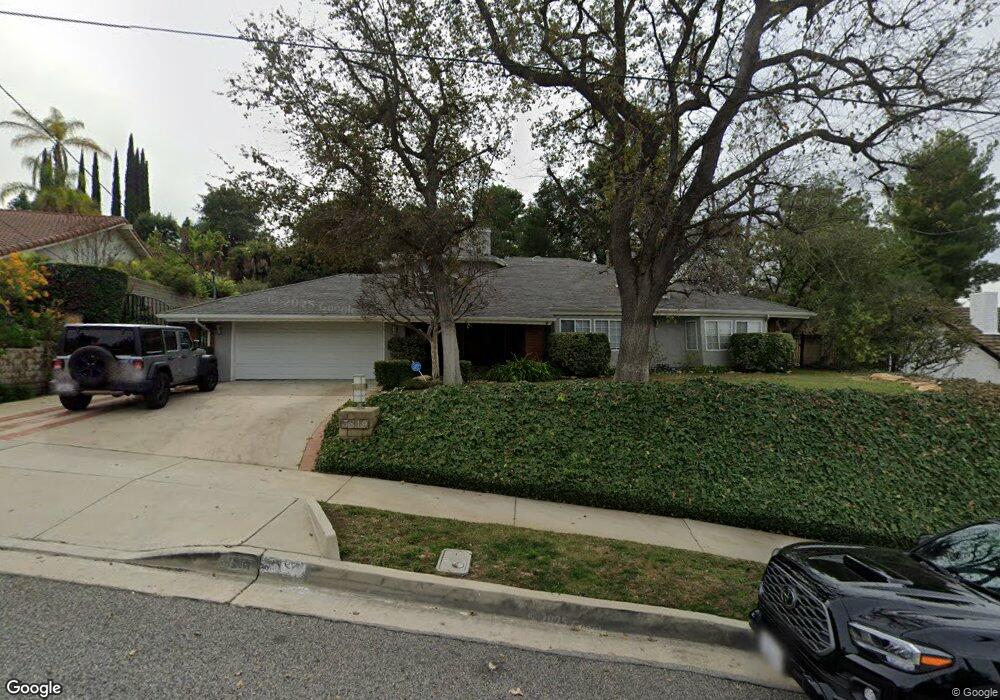
3819 Algonaut Dr Calabasas, CA 91302
Estimated Value: $1,700,895 - $1,936,000
5
Beds
3
Baths
2,794
Sq Ft
$664/Sq Ft
Est. Value
About This Home
This home is located at 3819 Algonaut Dr, Calabasas, CA 91302 and is currently estimated at $1,855,474, approximately $664 per square foot. 3819 Algonaut Dr is a home located in Los Angeles County with nearby schools including Chaparral Elementary School, Alice C. Stelle Middle School, and Calabasas High School.
Ownership History
Date
Name
Owned For
Owner Type
Purchase Details
Closed on
Sep 21, 2018
Sold by
Yumkas Mark D and Yumkas Nancy M
Bought by
Yumkas Mark and Yumkas Nancy M
Current Estimated Value
Purchase Details
Closed on
Feb 3, 2000
Sold by
Killick Gregory E and Killick Laurie
Bought by
Yumkas Mark D and Yumkas Nancy M
Home Financials for this Owner
Home Financials are based on the most recent Mortgage that was taken out on this home.
Original Mortgage
$275,000
Outstanding Balance
$90,642
Interest Rate
8.12%
Estimated Equity
$1,764,832
Purchase Details
Closed on
Nov 10, 1997
Sold by
Kiseskey Joseph P and Kiseskey Carolyn A
Bought by
Killick Gregory E and Killick Laurie Spicka
Home Financials for this Owner
Home Financials are based on the most recent Mortgage that was taken out on this home.
Original Mortgage
$180,000
Interest Rate
7.31%
Create a Home Valuation Report for This Property
The Home Valuation Report is an in-depth analysis detailing your home's value as well as a comparison with similar homes in the area
Home Values in the Area
Average Home Value in this Area
Purchase History
| Date | Buyer | Sale Price | Title Company |
|---|---|---|---|
| Yumkas Mark | -- | None Available | |
| Yumkas Mark | -- | None Available | |
| Yumkas Mark D | $567,000 | Progressive Title Company | |
| Killick Gregory E | $375,000 | United Title |
Source: Public Records
Mortgage History
| Date | Status | Borrower | Loan Amount |
|---|---|---|---|
| Open | Yumkas Mark D | $275,000 | |
| Previous Owner | Killick Gregory E | $180,000 |
Source: Public Records
Tax History
| Year | Tax Paid | Tax Assessment Tax Assessment Total Assessment is a certain percentage of the fair market value that is determined by local assessors to be the total taxable value of land and additions on the property. | Land | Improvement |
|---|---|---|---|---|
| 2025 | $11,212 | $965,037 | $534,550 | $430,487 |
| 2024 | $11,212 | $946,116 | $524,069 | $422,047 |
| 2023 | $10,916 | $927,566 | $513,794 | $413,772 |
| 2022 | $10,586 | $909,379 | $503,720 | $405,659 |
| 2021 | $10,563 | $891,549 | $493,844 | $397,705 |
| 2019 | $10,194 | $865,108 | $479,198 | $385,910 |
| 2018 | $10,016 | $848,146 | $469,802 | $378,344 |
| 2017 | $9,817 | $831,517 | $460,591 | $370,926 |
| 2016 | $9,492 | $815,213 | $451,560 | $363,653 |
| 2015 | $9,333 | $802,969 | $444,778 | $358,191 |
| 2014 | $9,209 | $787,241 | $436,066 | $351,175 |
Source: Public Records
Map
Nearby Homes
- 22505 Dardenne St
- 3627 Via Del Prado
- 22248 Cairnloch St
- 4032 Towhee Dr
- 22824 Sparrowdell Dr
- 4201 Topanga Canyon Blvd Unit 136
- 4201 Topanga Canyon Blvd Unit 189
- 4201 Topanga Canyon Blvd Unit 61
- 4201 Topanga Canyon Blvd Unit 62
- 4201 Topanga Canyon Blvd Unit 116
- 4201 Topanga Canyon Blvd Unit 28
- 22548 Waterbury St
- 3831 Saint Johnswood Dr
- 21825 Ambar Dr
- 22241 Alizondo Dr
- 3300 N Topanga Canyon Blvd
- 1 N Topanga Canyon Blvd
- 22957 De Kalb Dr
- 22232 Alizondo Dr
- 21616 Cezanne Place
- 3811 Algonaut Dr
- 3825 Algonaut Dr
- 22451 Calipatria Dr
- 22445 Calipatria Dr
- 3805 Algonaut Dr
- 3824 Algonaut Dr
- 22463 Calipatria Dr
- 3833 Algonaut Dr
- 22433 Calipatria Dr
- 3810 Algonaut Dr
- 3801 Algonaut Dr
- 22415 Calipatria Dr
- 22489 Calipatria Dr
- 3802 Algonaut Dr
- 3839 Algonaut Dr
- 3802 Daguerre Ave
- 22448 Calipatria Dr
- 22432 Dardenne St
- 22405 Calipatria Dr
- 22458 Calipatria Dr
Your Personal Tour Guide
Ask me questions while you tour the home.