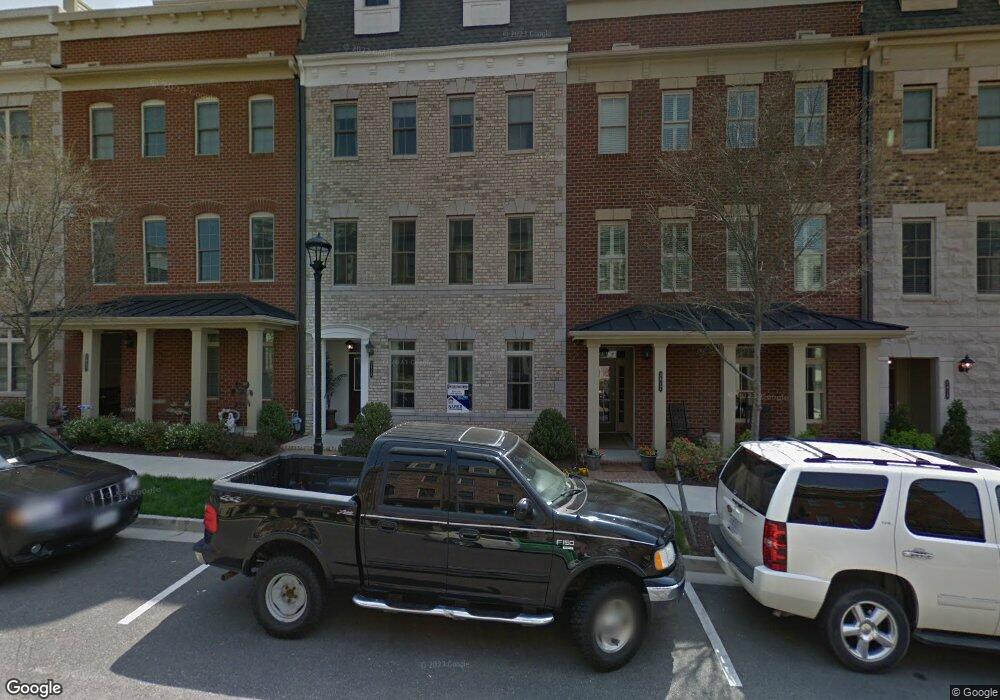
3819 Barnyard Trail Unit 3L Glen Allen, VA 23060
Short Pump NeighborhoodEstimated Value: $703,000 - $774,000
4
Beds
5
Baths
3,355
Sq Ft
$220/Sq Ft
Est. Value
About This Home
This home is located at 3819 Barnyard Trail Unit 3L, Glen Allen, VA 23060 and is currently estimated at $738,089, approximately $219 per square foot. 3819 Barnyard Trail Unit 3L is a home located in Henrico County with nearby schools including Colonial Trail Elementary School, Short Pump Middle School, and Deep Run High School.
Ownership History
Date
Name
Owned For
Owner Type
Purchase Details
Closed on
Jul 8, 2022
Sold by
Long Amani L and Long Stephen J
Bought by
Long Stephen J and Long Amani G
Current Estimated Value
Purchase Details
Closed on
May 27, 2015
Sold by
Royal Erica M
Bought by
Long Stephen J
Home Financials for this Owner
Home Financials are based on the most recent Mortgage that was taken out on this home.
Original Mortgage
$432,000
Interest Rate
3.62%
Mortgage Type
New Conventional
Purchase Details
Closed on
Mar 8, 2012
Sold by
Eagle Construction Of Va Llc
Bought by
Royal Erica M
Home Financials for this Owner
Home Financials are based on the most recent Mortgage that was taken out on this home.
Original Mortgage
$473,354
Interest Rate
4.25%
Mortgage Type
FHA
Create a Home Valuation Report for This Property
The Home Valuation Report is an in-depth analysis detailing your home's value as well as a comparison with similar homes in the area
Home Values in the Area
Average Home Value in this Area
Purchase History
| Date | Buyer | Sale Price | Title Company |
|---|---|---|---|
| Long Stephen J | -- | None Listed On Document | |
| Long Stephen J | $540,000 | -- | |
| Royal Erica M | $494,031 | -- |
Source: Public Records
Mortgage History
| Date | Status | Borrower | Loan Amount |
|---|---|---|---|
| Previous Owner | Long Stephen J | $432,000 | |
| Previous Owner | Royal Erica M | $473,354 |
Source: Public Records
Tax History Compared to Growth
Tax History
| Year | Tax Paid | Tax Assessment Tax Assessment Total Assessment is a certain percentage of the fair market value that is determined by local assessors to be the total taxable value of land and additions on the property. | Land | Improvement |
|---|---|---|---|---|
| 2025 | $5,874 | $683,100 | $115,000 | $568,100 |
| 2024 | $5,874 | $670,100 | $115,000 | $555,100 |
| 2023 | $5,696 | $670,100 | $115,000 | $555,100 |
| 2022 | $5,203 | $612,100 | $95,000 | $517,100 |
| 2021 | $4,929 | $566,600 | $85,000 | $481,600 |
| 2020 | $4,929 | $566,600 | $85,000 | $481,600 |
| 2019 | $4,929 | $566,600 | $85,000 | $481,600 |
| 2018 | $4,929 | $566,600 | $85,000 | $481,600 |
| 2017 | $4,829 | $555,100 | $85,000 | $470,100 |
| 2016 | $4,689 | $539,000 | $85,000 | $454,000 |
| 2015 | $4,625 | $582,000 | $85,000 | $497,000 |
| 2014 | $4,625 | $531,600 | $85,000 | $446,600 |
Source: Public Records
Map
Nearby Homes
- 3801 Duckling Walk
- 3950 Redbud Rd
- 3931 Village Townes Walk
- 1724 Old Brick Rd Unit A
- 1704 Old Brick Rd Unit A
- 1903 Old Brick Rd
- 115 Wellie Hill Place Unit A
- 0 Sligo Dr
- 11468 Sligo Dr
- Crosby Plan at Sadler Square
- Everly Plan at Sadler Square
- Arden Plan at Sadler Square
- 11305 Markham Ct
- 11628 Hainesland Dr
- 0 Belfast Rd Unit 2511329
- 11600 Coachmans Carriage Place
- 2401 Bell Tower Place
- 3213 Sweet Creek Ct
- Stonefield Plan at Nantucket Mews
- Southport Plan at Nantucket Mews
- 3821 Barnyard Trail Unit 2L
- 3821 Barnyard Trail Unit 3821
- 3821 Barnyard Trail
- 3819 Barnyard Trail
- 3823 Barnyard Trail Unit 1L
- 3823 Barnyard Trail Unit 3823
- 3823 Barnyard Trail
- 3817 Barnyard Trail Unit 3817
- 3817 Barnyard Trail
- 3817 Barnyard Trail Unit 4L
- 3817 Barnyard Trail
- 1902 Liesfeld Pkwy
- 1900 Liesfeld Pkwy Unit 1900
- 1902 Liesfeld Pkwy Unit 1902
- 3815 Barnyard Trail Unit 5L
- 3815 Barnyard Trail Unit 3815
- 3815 Barnyard Trail
- 3820 Duckling Walk
- 3816 Duckling Walk