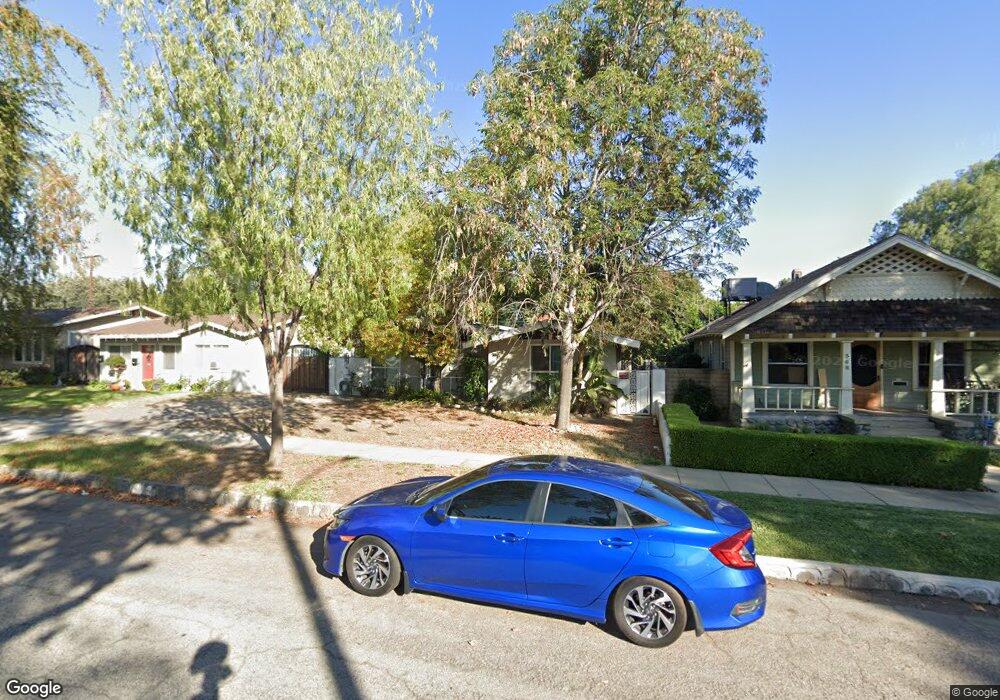
382 N Laurel Ave Upland, CA 91786
Estimated Value: $637,851 - $709,000
3
Beds
2
Baths
1,269
Sq Ft
$536/Sq Ft
Est. Value
About This Home
This home is located at 382 N Laurel Ave, Upland, CA 91786 and is currently estimated at $680,213, approximately $536 per square foot. 382 N Laurel Ave is a home located in San Bernardino County with nearby schools including Baldy View Elementary School, Upland Junior High School, and Upland High School.
Ownership History
Date
Name
Owned For
Owner Type
Purchase Details
Closed on
Jan 12, 2004
Sold by
Lo Rosa Shelli and Lo Bue Shelli Palmer
Bought by
Rosa Kristopher and Rosa Shelli
Current Estimated Value
Home Financials for this Owner
Home Financials are based on the most recent Mortgage that was taken out on this home.
Original Mortgage
$185,000
Outstanding Balance
$87,237
Interest Rate
6.02%
Mortgage Type
New Conventional
Estimated Equity
$592,976
Purchase Details
Closed on
Feb 11, 1997
Sold by
Lo Bue Paul G
Bought by
Lobue Shelli Palmer
Purchase Details
Closed on
Jul 29, 1994
Sold by
Schmekel Eugene A and Schmekel Ruby N
Bought by
Lobue Paul G and Lobue Shelli A
Home Financials for this Owner
Home Financials are based on the most recent Mortgage that was taken out on this home.
Original Mortgage
$110,000
Interest Rate
8.91%
Mortgage Type
Seller Take Back
Create a Home Valuation Report for This Property
The Home Valuation Report is an in-depth analysis detailing your home's value as well as a comparison with similar homes in the area
Home Values in the Area
Average Home Value in this Area
Purchase History
| Date | Buyer | Sale Price | Title Company |
|---|---|---|---|
| Rosa Kristopher | -- | Investors Title Co San Bern | |
| Lobue Shelli Palmer | -- | -- | |
| Lobue Paul G | $115,000 | Chicago Title Company |
Source: Public Records
Mortgage History
| Date | Status | Borrower | Loan Amount |
|---|---|---|---|
| Open | Rosa Kristopher | $185,000 | |
| Previous Owner | Lobue Paul G | $110,000 |
Source: Public Records
Tax History Compared to Growth
Tax History
| Year | Tax Paid | Tax Assessment Tax Assessment Total Assessment is a certain percentage of the fair market value that is determined by local assessors to be the total taxable value of land and additions on the property. | Land | Improvement |
|---|---|---|---|---|
| 2025 | $2,133 | $193,166 | $58,790 | $134,376 |
| 2024 | $2,133 | $189,378 | $57,637 | $131,741 |
| 2023 | $2,098 | $185,665 | $56,507 | $129,158 |
| 2022 | $2,051 | $182,024 | $55,399 | $126,625 |
| 2021 | $2,043 | $178,455 | $54,313 | $124,142 |
| 2020 | $1,987 | $176,625 | $53,756 | $122,869 |
| 2019 | $1,980 | $173,162 | $52,702 | $120,460 |
| 2018 | $1,933 | $169,767 | $51,669 | $118,098 |
| 2017 | $1,876 | $166,438 | $50,656 | $115,782 |
| 2016 | $1,693 | $163,175 | $49,663 | $113,512 |
| 2015 | $1,654 | $160,724 | $48,917 | $111,807 |
| 2014 | $1,610 | $157,576 | $47,959 | $109,617 |
Source: Public Records
Map
Nearby Homes
- Plan 3 at Towns on First - Towns On First
- Plan 4 at Towns on First - Towns On First
- 119 N 1st Ave
- 435 W 9th St Unit F5
- 435 W 9th St Unit B3
- 691 N 3rd Ave
- 537 W 9th St
- 164 Euclid Place
- 855 N Palm Ave
- 511 D St
- 524 E Arrow Hwy
- 173 W 8th St
- 556 D St
- 910 N Redding Way Unit F
- 173 Elizabeth Ln
- 144 Dorsett Ave
- 110 Royal Way
- 928 N Redding Way Unit D
- 152 Dorsett Ave
- 228 Greentree Rd
- 368 N Laurel Ave
- 400 N Laurel Ave
- 348 N Laurel Ave
- 418 N Laurel Ave
- 436 N Laurel Ave
- 391 N Euclid Ave
- 379 N Euclid Ave
- 401 N Euclid Ave
- 359 N Euclid Ave
- 79 Vernon Dr
- 61 Vernon Dr
- 93 Vernon Dr
- 425 N Euclid Ave
- 341 N Euclid Ave
- 383 N Laurel Ave
- 397 N Laurel Ave
- 351 N Laurel Ave
- 417 N Laurel Ave
- 443 N Euclid Ave
- 323 N Euclid Ave