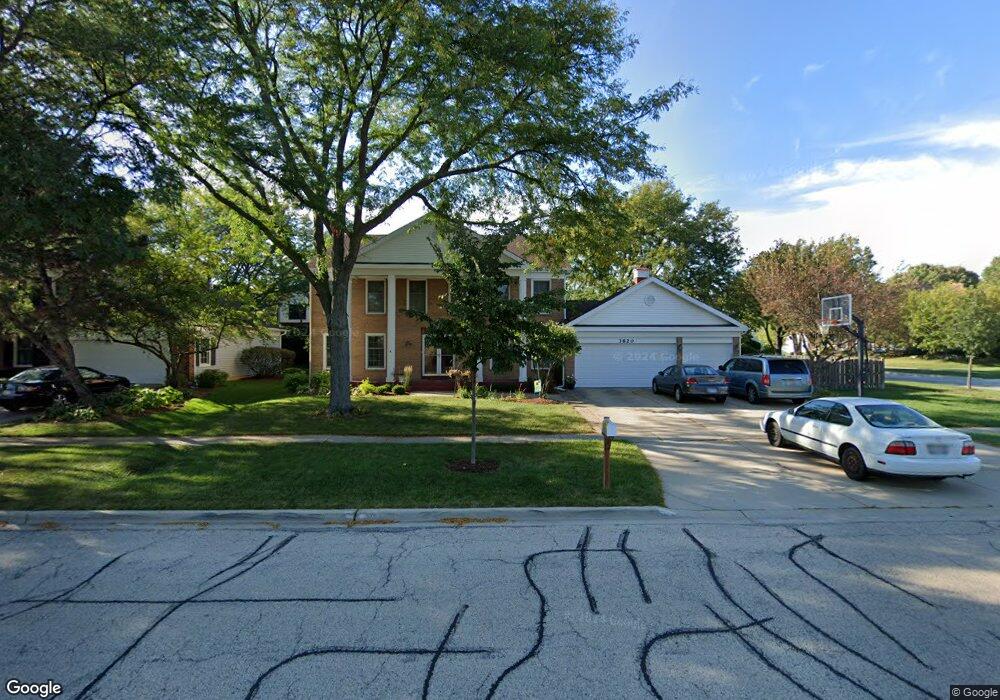
3820 Charlemagne Dr Hoffman Estates, IL 60192
South Ridge NeighborhoodEstimated Value: $662,184 - $705,000
4
Beds
3
Baths
2,969
Sq Ft
$232/Sq Ft
Est. Value
About This Home
This home is located at 3820 Charlemagne Dr, Hoffman Estates, IL 60192 and is currently estimated at $688,546, approximately $231 per square foot. 3820 Charlemagne Dr is a home located in Cook County with nearby schools including Thomas Jefferson Elementary School, Carl Sandburg Junior High School, and William Fremd High School.
Ownership History
Date
Name
Owned For
Owner Type
Purchase Details
Closed on
Nov 4, 2011
Sold by
Buesing William R and Buesing Jennifer R
Bought by
Buesing William R and William R Buesing Trust
Current Estimated Value
Purchase Details
Closed on
Aug 22, 2005
Sold by
Kim David and Kim Linda
Bought by
Buesing William R and Buesing Jennifer R
Home Financials for this Owner
Home Financials are based on the most recent Mortgage that was taken out on this home.
Original Mortgage
$359,650
Outstanding Balance
$193,159
Interest Rate
6.01%
Mortgage Type
Fannie Mae Freddie Mac
Estimated Equity
$495,387
Purchase Details
Closed on
May 31, 2002
Sold by
Kim Samuel S and Kim Jane
Bought by
Kim David
Home Financials for this Owner
Home Financials are based on the most recent Mortgage that was taken out on this home.
Original Mortgage
$400,000
Interest Rate
7%
Create a Home Valuation Report for This Property
The Home Valuation Report is an in-depth analysis detailing your home's value as well as a comparison with similar homes in the area
Home Values in the Area
Average Home Value in this Area
Purchase History
| Date | Buyer | Sale Price | Title Company |
|---|---|---|---|
| Buesing William R | -- | None Available | |
| Buesing William R | $580,000 | 1St American Title | |
| Kim David | $445,000 | -- |
Source: Public Records
Mortgage History
| Date | Status | Borrower | Loan Amount |
|---|---|---|---|
| Open | Buesing William R | $359,650 | |
| Previous Owner | Kim David | $400,000 |
Source: Public Records
Tax History Compared to Growth
Tax History
| Year | Tax Paid | Tax Assessment Tax Assessment Total Assessment is a certain percentage of the fair market value that is determined by local assessors to be the total taxable value of land and additions on the property. | Land | Improvement |
|---|---|---|---|---|
| 2024 | $12,404 | $44,205 | $10,893 | $33,312 |
| 2023 | $12,440 | $44,205 | $10,893 | $33,312 |
| 2022 | $12,440 | $45,808 | $10,893 | $34,915 |
| 2021 | $12,029 | $39,641 | $6,483 | $33,158 |
| 2020 | $11,849 | $39,641 | $6,483 | $33,158 |
| 2019 | $11,682 | $43,803 | $6,483 | $37,320 |
| 2018 | $10,608 | $37,052 | $5,965 | $31,087 |
| 2017 | $11,628 | $40,940 | $5,965 | $34,975 |
| 2016 | $12,163 | $44,800 | $5,965 | $38,835 |
| 2015 | $12,275 | $42,262 | $5,446 | $36,816 |
| 2014 | $12,064 | $42,262 | $5,446 | $36,816 |
| 2013 | $11,732 | $42,262 | $5,446 | $36,816 |
Source: Public Records
Map
Nearby Homes
- 3925 Charlemagne Dr
- 3835 Huntington Blvd
- 3666 Whispering Trails Dr
- 3991 Whispering Trails Dr
- 1860 Burr Ridge Dr
- 4090 N Parkside Dr
- 1980 Dogwood Dr
- 4320 Lombardy Ln
- 3960 Colony Ct
- 26 Forest Ln
- 16 Forest Ln
- 815 Concord Cove
- 85 E Mundhank Rd
- 87 E Mundhank Rd
- 39 Forest Ln
- 1404 W Sapphire Dr
- 13 Chipping Campden Dr
- 4658 Burnham Dr
- Lot 4 E Mundhank Rd
- 4797 Amber Cir
- 3810 Charlemagne Dr
- 3850 Moulin Ln
- 3850 Charlemagne Dr
- 3800 Charlemagne Dr
- 3855 Moulin Ln
- 3815 Charlemagne Dr
- 3865 Moulin Ln
- 3835 Charlemagne Dr
- 3854 Moulin Ln
- 3805 Charlemagne Dr
- 3845 Charlemagne Dr
- 1540 Charlemagne Dr
- 3860 Charlemagne Dr
- 1535 Laburnum Rd
- 3875 Moulin Ln
- 3860 Moulin Ln
- 3800 Anjou Ln
- 3810 Anjou Ln
- 3855 Charlemagne Dr
- 3790 Anjou Ln