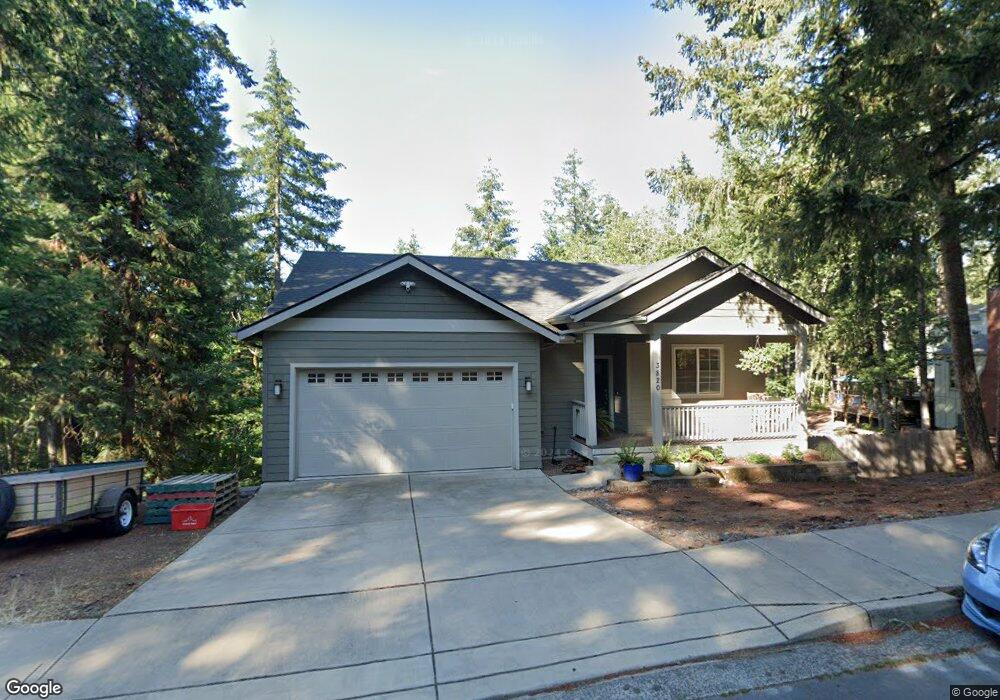
3820 Vine Maple St Eugene, OR 97405
Southeast Eugene NeighborhoodEstimated Value: $740,295 - $885,000
3
Beds
3
Baths
2,085
Sq Ft
$389/Sq Ft
Est. Value
About This Home
This home is located at 3820 Vine Maple St, Eugene, OR 97405 and is currently estimated at $811,074, approximately $389 per square foot. 3820 Vine Maple St is a home located in Lane County with nearby schools including Camas Ridge Community Elementary School, Roosevelt Middle School, and South Eugene High School.
Ownership History
Date
Name
Owned For
Owner Type
Purchase Details
Closed on
Aug 16, 2024
Sold by
Freemerman Alex Jay and Maloney Nancy Jane
Bought by
Alex Jay Freemerman And Nancy Jane Maloney Tr and Freemerman
Current Estimated Value
Purchase Details
Closed on
Mar 21, 2017
Sold by
Hoviss Development Group Llc
Bought by
Maloney Nancy J and Freemerman Alex
Home Financials for this Owner
Home Financials are based on the most recent Mortgage that was taken out on this home.
Original Mortgage
$383,920
Interest Rate
4.17%
Mortgage Type
New Conventional
Purchase Details
Closed on
Jan 28, 2016
Sold by
Roshto Caryn
Bought by
Hovis Development Group Llc
Purchase Details
Closed on
Jul 16, 2014
Sold by
Roshto Travis
Bought by
Roshto Caryn
Purchase Details
Closed on
Apr 18, 2002
Sold by
Vitums Susan J and The Susan J Vitums Revocable T
Bought by
Roshto Travis and Roshto Caryn
Create a Home Valuation Report for This Property
The Home Valuation Report is an in-depth analysis detailing your home's value as well as a comparison with similar homes in the area
Home Values in the Area
Average Home Value in this Area
Purchase History
| Date | Buyer | Sale Price | Title Company |
|---|---|---|---|
| Alex Jay Freemerman And Nancy Jane Maloney Tr | -- | None Listed On Document | |
| Maloney Nancy J | $479,900 | Cascade Title Co | |
| Hovis Development Group Llc | $50,000 | Western Title & Escrow Co | |
| Roshto Caryn | -- | First American Title | |
| Roshto Travis | $44,000 | Cascade Title Co |
Source: Public Records
Mortgage History
| Date | Status | Borrower | Loan Amount |
|---|---|---|---|
| Previous Owner | Maloney Nancy J | $383,920 |
Source: Public Records
Tax History
| Year | Tax Paid | Tax Assessment Tax Assessment Total Assessment is a certain percentage of the fair market value that is determined by local assessors to be the total taxable value of land and additions on the property. | Land | Improvement |
|---|---|---|---|---|
| 2025 | $8,099 | $415,700 | -- | -- |
| 2024 | $7,999 | $403,593 | -- | -- |
| 2023 | $7,999 | $391,838 | $0 | $0 |
| 2022 | $7,493 | $380,426 | $0 | $0 |
| 2021 | $7,038 | $369,346 | $0 | $0 |
| 2020 | $7,063 | $358,589 | $0 | $0 |
| 2019 | $6,582 | $335,909 | $0 | $0 |
| 2018 | $6,195 | $175,233 | $0 | $0 |
| 2017 | $3,275 | $175,233 | $0 | $0 |
| 2016 | $1,042 | $55,505 | $0 | $0 |
| 2015 | $1,012 | $53,888 | $0 | $0 |
| 2014 | $992 | $52,318 | $0 | $0 |
Source: Public Records
Map
Nearby Homes
- 0 N Shasta Loop Unit 384285834
- 3945 Spring Blvd
- 3790 Onyx St
- 1210 E 38th Ave
- 4015 Spring Knoll Dr
- 3605 Emerald St
- 3574 Spring Blvd
- 4835 Elva Ln
- 1996 Kimberly Dr
- 0 Wendell Ln Unit 200453475
- 0 Wendell Ln Unit 279865930
- 0 Wendell Ln Unit 1
- 1180 E 37th Ave
- 3283 Stoney Ridge Rd
- 1755 E 43rd Ave
- 4080 Spring Blvd
- 1865 E 43rd Ave
- 3817 E Amazon Dr
- 2040 Dogwood Dr
- 1862 E 43rd Ave
- 3810 Vine Maple St
- 3815 Vine Maple St
- 3830 Vine Maple St
- 3927 Shasta View St
- 3827 Vine Maple St
- 3799 N Shasta Loop
- 3800 Vine Maple St
- 3921 Shasta View St
- 3840 Vine Maple St
- 3855 N Shasta Loop
- 3787 N Shasta Loop
- 3843 Vine Maple St
- 3820 Spring Blvd
- 3947 Shasta View St
- 3830 Spring Blvd
- 3877 N Shasta Loop
- 3948 Shasta View St
- 3926 Shasta View St
- 0 Vine Maple St Unit TL900
- 2300 Spring Blvd
Your Personal Tour Guide
Ask me questions while you tour the home.