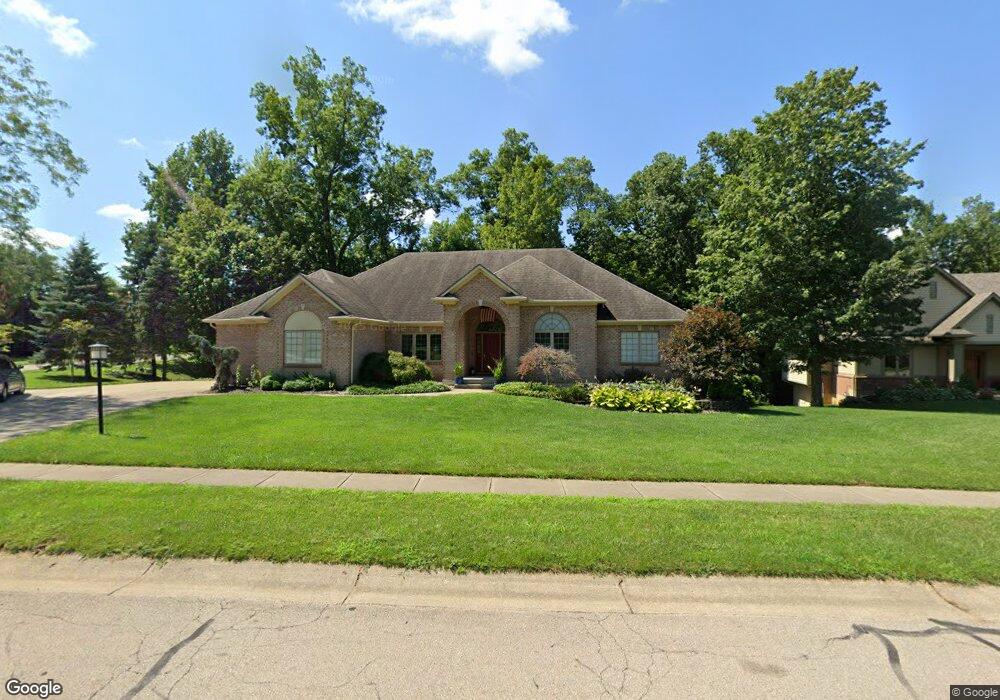
3821 Coffeat Ct Bellbrook, OH 45305
Estimated Value: $584,000 - $680,000
4
Beds
3
Baths
3,750
Sq Ft
$169/Sq Ft
Est. Value
About This Home
This home is located at 3821 Coffeat Ct, Bellbrook, OH 45305 and is currently estimated at $634,441, approximately $169 per square foot. 3821 Coffeat Ct is a home located in Greene County with nearby schools including Bell Creek Intermediate School, Stephen Bell Elementary School, and Bellbrook Middle School.
Ownership History
Date
Name
Owned For
Owner Type
Purchase Details
Closed on
Jul 22, 2022
Sold by
Herres Steven M
Bought by
Clementz Dominic and Clementz Melissa
Current Estimated Value
Home Financials for this Owner
Home Financials are based on the most recent Mortgage that was taken out on this home.
Original Mortgage
$564,620
Outstanding Balance
$540,369
Interest Rate
5.81%
Mortgage Type
VA
Estimated Equity
$94,072
Purchase Details
Closed on
Dec 20, 2019
Sold by
Herres Real Estate Llc
Bought by
Herres Steven M
Purchase Details
Closed on
Dec 3, 2018
Sold by
Paulus William J and Paulus Miriam F
Bought by
Herres Real Estate L L C
Purchase Details
Closed on
May 31, 2000
Sold by
Thompson Don Excavating Inc
Bought by
Earley Charles J
Purchase Details
Closed on
Dec 18, 1997
Sold by
Dore Dev Ltd
Bought by
Don Thompson Excavating Inc
Create a Home Valuation Report for This Property
The Home Valuation Report is an in-depth analysis detailing your home's value as well as a comparison with similar homes in the area
Home Values in the Area
Average Home Value in this Area
Purchase History
| Date | Buyer | Sale Price | Title Company |
|---|---|---|---|
| Clementz Dominic | -- | None Listed On Document | |
| Herres Steven M | -- | None Available | |
| Herres Real Estate L L C | $400,000 | None Available | |
| Earley Charles J | $73,000 | -- | |
| Don Thompson Excavating Inc | $99,600 | -- |
Source: Public Records
Mortgage History
| Date | Status | Borrower | Loan Amount |
|---|---|---|---|
| Open | Clementz Dominic | $564,620 |
Source: Public Records
Tax History Compared to Growth
Tax History
| Year | Tax Paid | Tax Assessment Tax Assessment Total Assessment is a certain percentage of the fair market value that is determined by local assessors to be the total taxable value of land and additions on the property. | Land | Improvement |
|---|---|---|---|---|
| 2024 | $8,516 | $173,960 | $26,250 | $147,710 |
| 2023 | $8,516 | $173,960 | $26,250 | $147,710 |
| 2022 | $9,049 | $136,470 | $21,880 | $114,590 |
| 2021 | $9,150 | $136,470 | $21,880 | $114,590 |
| 2020 | $8,750 | $136,470 | $21,880 | $114,590 |
| 2019 | $9,231 | $132,090 | $22,660 | $109,430 |
| 2018 | $8,434 | $132,090 | $22,660 | $109,430 |
| 2017 | $8,226 | $132,090 | $22,660 | $109,430 |
| 2016 | $7,837 | $119,900 | $22,660 | $97,240 |
| 2015 | $7,711 | $119,900 | $22,660 | $97,240 |
| 2014 | $7,115 | $119,900 | $22,660 | $97,240 |
Source: Public Records
Map
Nearby Homes
- 3870 Feather Heights Ct
- 1359 Soaring Heights Dr
- 1442 Timshel St
- 5425 Little Sugar Creek Rd
- 3812 Oak Creek Dr
- 1692 Glenwood Way
- 3509 Marwood Dr
- 2018 Amberwood Ct
- 1002 Belfast Dr
- 4202 Ellason Ct
- 4201 Ellason Ct
- 4275 Galway Ct
- 4204 N Golden Clove Bend Unit 56-305
- 4208 N Golden Clove Bend Unit 56-103
- 4214 N Golden Clove Bend Unit 56-102
- 4218 N Golden Clove Bend Unit 56-300
- 4216 N Golden Clove Bend Unit 56-302
- 4222 N Golden Clove Bend Unit 56-201
- 4220 N Golden Clove Bend Unit 56-301
- 4283 Ellason
- 1167 Deerbluff Dr
- 3831 Coffeat Ct
- 3803 Coffeat Dr
- 3818 Coffeat Ct
- 3834 Coffeat Ct
- 3830 Coffeat Ct
- 1142 Deerbluff Dr
- 3860 Feedwire Rd
- 3818 Fernwood Ct
- 3788 Coffeat Dr
- 1108 Paxon Ct
- 1295 Soaring Heights Dr
- 1130 Deerbluff Dr
- 1111 Deerbluff Dr
- 3812 Fernwood Ct
- 3870 Feedwire Rd
- 3822 Fernwood Ct
- 3779 Coffeat Dr
- 1149 Roger Scott Dr
- 1133 Roger Scott Dr