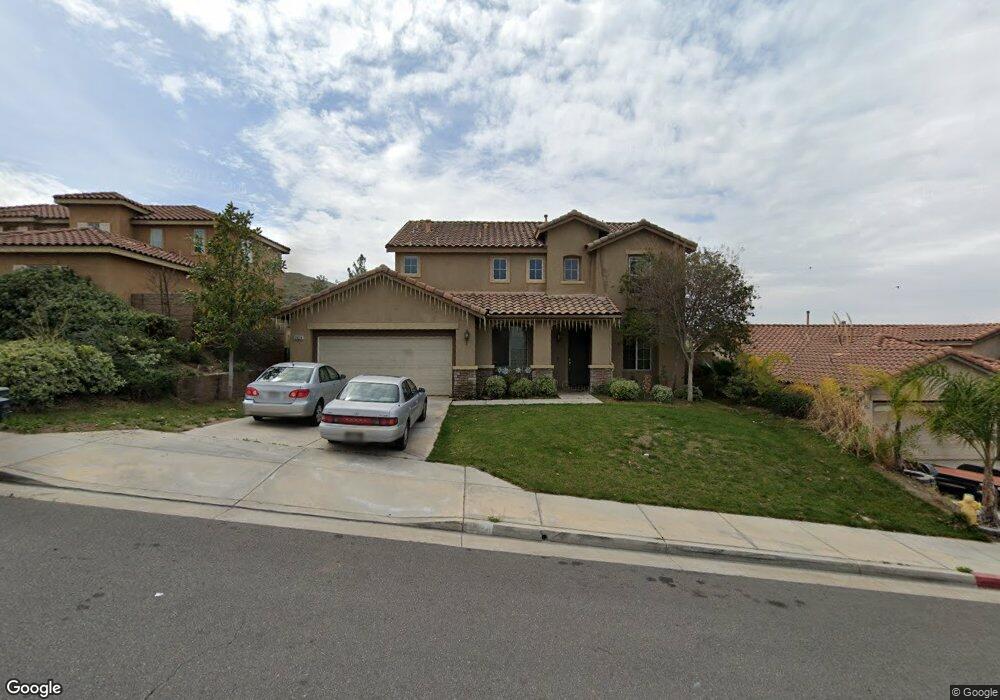
3824 Peridot Ct Perris, CA 92570
South Perris NeighborhoodEstimated Value: $530,000 - $602,000
4
Beds
3
Baths
2,107
Sq Ft
$263/Sq Ft
Est. Value
About This Home
This home is located at 3824 Peridot Ct, Perris, CA 92570 and is currently estimated at $554,759, approximately $263 per square foot. 3824 Peridot Ct is a home located in Riverside County with nearby schools including Pinacate Middle School, Ethan A. Chase Middle School, and Heritage High School.
Ownership History
Date
Name
Owned For
Owner Type
Purchase Details
Closed on
Sep 24, 2020
Sold by
Pingel Rocio Quezada and Quezada Rocio
Bought by
Pingel Rocio Quezada
Current Estimated Value
Home Financials for this Owner
Home Financials are based on the most recent Mortgage that was taken out on this home.
Original Mortgage
$324,800
Outstanding Balance
$261,457
Interest Rate
2.9%
Mortgage Type
New Conventional
Estimated Equity
$293,302
Purchase Details
Closed on
Oct 28, 2016
Sold by
Pingel Abraham O
Bought by
Pingel Rocio Quezada
Purchase Details
Closed on
Dec 8, 2015
Sold by
Pingel Abraham Omar
Bought by
Quezada Rocio
Purchase Details
Closed on
Nov 24, 2003
Sold by
River View Estates Associates Llc
Bought by
Pingel Abraham Omar and Pingel Rocio Quezada
Home Financials for this Owner
Home Financials are based on the most recent Mortgage that was taken out on this home.
Original Mortgage
$216,535
Interest Rate
5.8%
Mortgage Type
Purchase Money Mortgage
Create a Home Valuation Report for This Property
The Home Valuation Report is an in-depth analysis detailing your home's value as well as a comparison with similar homes in the area
Home Values in the Area
Average Home Value in this Area
Purchase History
| Date | Buyer | Sale Price | Title Company |
|---|---|---|---|
| Pingel Rocio Quezada | -- | First American Title | |
| Pingel Rocio Quezada | -- | None Available | |
| Quezada Rocio | -- | None Available | |
| Pingel Abraham Omar | $271,000 | Fidelity National Title Co R |
Source: Public Records
Mortgage History
| Date | Status | Borrower | Loan Amount |
|---|---|---|---|
| Open | Pingel Rocio Quezada | $324,800 | |
| Previous Owner | Pingel Abraham Omar | $216,535 | |
| Closed | Pingel Abraham Omar | $54,133 |
Source: Public Records
Tax History
| Year | Tax Paid | Tax Assessment Tax Assessment Total Assessment is a certain percentage of the fair market value that is determined by local assessors to be the total taxable value of land and additions on the property. | Land | Improvement |
|---|---|---|---|---|
| 2025 | $6,371 | $384,806 | $85,295 | $299,511 |
| 2023 | $6,371 | $369,866 | $81,984 | $287,882 |
| 2022 | $6,096 | $362,615 | $80,377 | $282,238 |
| 2021 | $5,923 | $355,505 | $78,801 | $276,704 |
| 2020 | $5,836 | $351,860 | $77,993 | $273,867 |
| 2019 | $5,713 | $344,962 | $76,464 | $268,498 |
| 2018 | $5,501 | $338,199 | $74,965 | $263,234 |
| 2017 | $5,059 | $299,000 | $66,000 | $233,000 |
| 2016 | $4,705 | $268,000 | $59,000 | $209,000 |
| 2015 | $4,499 | $253,000 | $56,000 | $197,000 |
| 2014 | $4,393 | $246,000 | $55,000 | $191,000 |
Source: Public Records
Map
Nearby Homes
- 131 Quartz Ln
- 172 Goldenrod Ave
- 198 Caldera St
- 3736 Peak Trail
- 203 Alabaster Loop
- 26615 Silver Ore Rd
- 26645 Silver Ore Rd
- 3701 Tower Ln
- 25164 Forest Hills Dr
- 25166 Banded Hills Dr
- 3609 Pyramid Trail
- 26595 Silver Ore Rd
- 25328 Violane Dr
- 0 Sotelo Unit IV25258970
- 332 Monument Pkwy
- 335 Pinnacle St
- 150 Saddleback Way
- 27224 Felsic Dr
- 0 Goetz Rd Unit OC25198529
- 0 Goetz Rd Unit PW25216572
- 3826 Peridot Ct
- 3822 Peridot Ct
- 3828 Peridot Ct
- 3820 Peridot Ct
- 3825 Peridot Ct
- 3823 Peridot Ct
- 3827 Peridot Ct
- 3830 Peridot Ct
- 3821 Peridot Ct
- 147 Malachite Ln
- 3829 Peridot Ct
- 3819 Peridot Ct
- 3823 Tanzanite Ct
- 149 Malachite Ln
- 3832 Peridot Ct
- 3825 Tanzanite Ct
- 3817 Peridot Ct
- 3827 Tanzanite Ct
- 151 Malachite Ln
- 3835 Peridot Ct
Your Personal Tour Guide
Ask me questions while you tour the home.