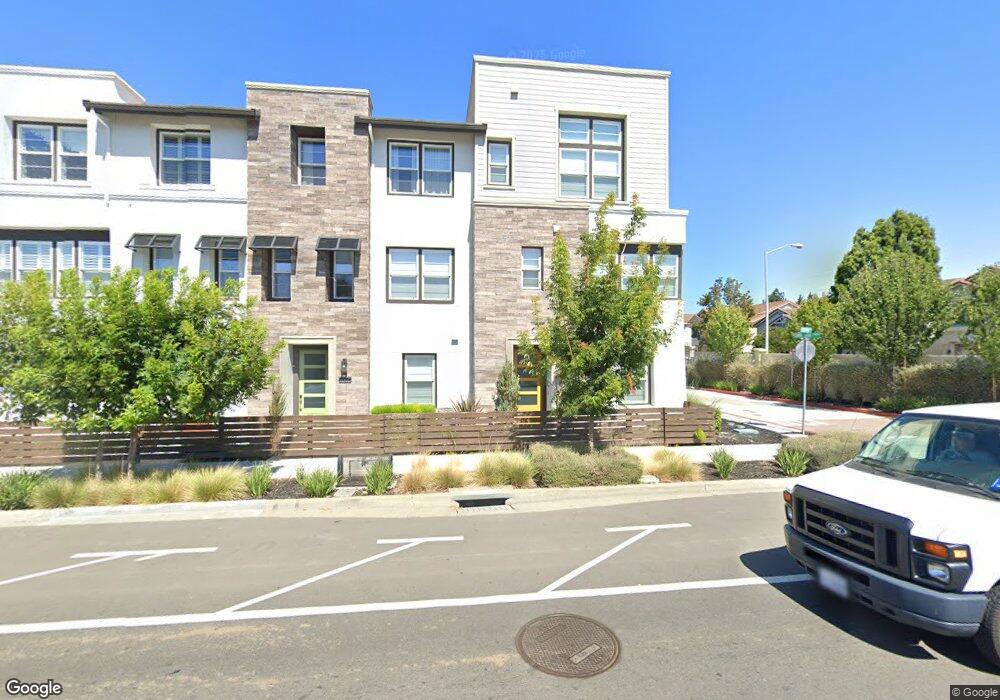
3824 Springfield Common Fremont, CA 94555
Northgate-Union City NeighborhoodEstimated Value: $1,629,656 - $1,852,000
5
Beds
3
Baths
2,003
Sq Ft
$876/Sq Ft
Est. Value
About This Home
This home is located at 3824 Springfield Common, Fremont, CA 94555 and is currently estimated at $1,755,164, approximately $876 per square foot. 3824 Springfield Common is a home located in Alameda County with nearby schools including Patterson Elementary School, Thornton Middle School, and American High School.
Ownership History
Date
Name
Owned For
Owner Type
Purchase Details
Closed on
Feb 10, 2015
Sold by
Chow Chow Henry Ginhai Henry Ginhai and Chow Lo Victoria Ginyu
Bought by
Feng Shixiong and Kang Ying
Current Estimated Value
Purchase Details
Closed on
Aug 2, 2011
Sold by
Chow David Ding Yu and Chow Angela Chung Chen
Bought by
Chow Chow Henry Ginhai Henry Ginhai and Chow Lo Victoria Ginyu
Purchase Details
Closed on
Sep 3, 2003
Sold by
Mekala Ganesh Reddy and Rani Indira
Bought by
Chow David Ding Yu and Chow Angela Chung Chen
Purchase Details
Closed on
Dec 13, 2000
Sold by
Mekala Ganesh R and Rani Indira
Bought by
Mekala Ganesh Reddy and Rani Indira
Purchase Details
Closed on
Jul 14, 1998
Sold by
Scs Development Co
Bought by
Mekala Ganesh R and Rani Indira
Home Financials for this Owner
Home Financials are based on the most recent Mortgage that was taken out on this home.
Original Mortgage
$325,656
Interest Rate
6.75%
Create a Home Valuation Report for This Property
The Home Valuation Report is an in-depth analysis detailing your home's value as well as a comparison with similar homes in the area
Home Values in the Area
Average Home Value in this Area
Purchase History
| Date | Buyer | Sale Price | Title Company |
|---|---|---|---|
| Feng Shixiong | $972,500 | Chicago Title Company | |
| Chu Nancy Chow | -- | Chicago Title Company | |
| Shaw Sandra Ginsan | -- | Chicago Title Company | |
| Chow Henry Ginhai | -- | Chicago Title Company | |
| Chow Chow Henry Ginhai Henry Ginhai | -- | None Available | |
| Chow David Ding Yu | $590,000 | Fidelity National Title Co | |
| Mekala Ganesh Reddy | -- | -- | |
| Mekala Ganesh R | $407,500 | First American Title Guarant |
Source: Public Records
Mortgage History
| Date | Status | Borrower | Loan Amount |
|---|---|---|---|
| Previous Owner | Mekala Ganesh R | $325,656 |
Source: Public Records
Tax History
| Year | Tax Paid | Tax Assessment Tax Assessment Total Assessment is a certain percentage of the fair market value that is determined by local assessors to be the total taxable value of land and additions on the property. | Land | Improvement |
|---|---|---|---|---|
| 2025 | $13,722 | $1,161,760 | $360,543 | $808,217 |
| 2024 | $13,722 | $1,138,848 | $353,475 | $792,373 |
| 2023 | $13,362 | $1,123,383 | $346,545 | $776,838 |
| 2022 | $13,201 | $1,094,356 | $339,750 | $761,606 |
| 2021 | $12,873 | $1,072,766 | $333,090 | $746,676 |
| 2020 | $12,949 | $1,068,699 | $329,676 | $739,023 |
| 2019 | $12,799 | $1,047,752 | $323,214 | $724,538 |
| 2018 | $12,550 | $1,027,212 | $316,878 | $710,334 |
| 2017 | $12,235 | $1,007,072 | $310,665 | $696,407 |
| 2016 | $12,033 | $987,330 | $304,575 | $682,755 |
| 2015 | $8,197 | $658,903 | $194,047 | $464,856 |
| 2014 | $8,055 | $645,999 | $190,247 | $455,752 |
Source: Public Records
Map
Nearby Homes
- 34362 Enea Terrace Unit 2
- 3863 Milton Terrace
- 3868 Fiano Common
- 33934 Sagrantino Terrace
- 4229 Tanager Common
- 4235 Tanager Common
- 4015 Clydesdale Common
- 34597 Bluestone Common
- 34373 Auckland Ct
- 3327 Trafalgar Rd
- 3754 Bobwhite Terrace
- 4409 Darwin Dr
- 34184 Duke Ln
- 3091 Seymour Place
- 33499 Quail Run Rd
- 34936 Machado Common
- 4691 Rousillon Ave
- 4141 Deep Creek Rd Unit 89
- 4141 Deep Creek Rd Unit 106
- 4141 Deep Creek Rd Unit 84
- 3828 Springfield Common
- 34254 Fremont Blvd
- 3823 Springfield Common
- 3942 Springfield Common
- 3938 Springfield Common
- 3832 Springfield Common
- 3827 Springfield Common
- 3946 Springfield Common
- 3934 Springfield Common
- 3831 Springfield Common
- 3950 Springfield Common
- 34117 Songbird Terrace
- 3930 Springfield Common
- 34240 Fremont Blvd
- 34125 Blue Jay Terrace
- 34105 Blue Jay Terrace
- 34326 Fremont Blvd
- 3836 Springfield Common
- 3926 Springfield Common
- 3844 Springfield Common
Your Personal Tour Guide
Ask me questions while you tour the home.